

Two weeks ago, the DC Office of the State Superintendent of Education (OSSE) released results from the 2026 state assessments—commonly referred to by their acronym, CAPE (Comprehensive Assessments of Progress in Education)—in math and English language arts (ELA).1 DC students improved for the fourth consecutive year, with gains in both subjects and across every student group. ELA proficiency, up 2 percentage points, now sits at its highest level since the District moved to computer-based testing in 2015, and math improved by 2.1 percentage points at the college-ready benchmark (the CAPE test places students at five levels, with Level 4+ indicating that students have mastered the material and are on-track to succeed in a four-year college).
At the career-ready benchmark (CAPE 3+), six in 10 students met the standard in English language arts this spring, up from 58 percent a year ago. In math, 51 percent cleared the bar, up from 48 percent. Since 2022, the first year of testing after the pandemic closure, the share of students on track for career readiness climbed 8 points in reading and 10 points in math. DC schools also posted a reduction (-3.3%) in the percent of students furthest behind (Level 1) in math, the largest single-year decrease in Level 1 students in the PARCC/CAPE era.
This blog post delves into where DC’s students are improving academically and where we have more work to do to reach and exceed pre-pandemic levels of learning. This year’s results give us reasons to celebrate, and they should sharpen our sense of urgency to continue the hard work to further accelerate outcomes for all students. Three themes stand out in the data:
Achievement gaps narrowed and student poverty is less predictive of school performance in math and reading. In fact, the correlation between socioeconomic status of a school’s student body and its proficiency rate is the lowest in DC state test history. Yet, differences in performance between student groups remain stark, requiring continued urgency from adults and focus on equitable distribution of resources to support priority student groups.
Cohorts of students in grades 3-8 from 2022 to 2026 show stronger annual proficiency gains across five post-pandemic test administrations than similarly aged students’ pre-pandemic, five-year trend in ELA and math. Overall, annual statewide gains in math are stronger post-pandemic than pre-pandemic. ELA results show similar improvement to pre-pandemic trends even though post-pandemic proficiency rates started higher than where DC students achieved back in 2015. We also compare the progress of two cohorts of economically disadvantaged students, those in 3rd and 4th grade in 2022 with those in 3rd and 4th grade in 2015, across five years. Improvement in annual cohort gains indicate that our educational system is likely stronger now than it was pre-pandemic.
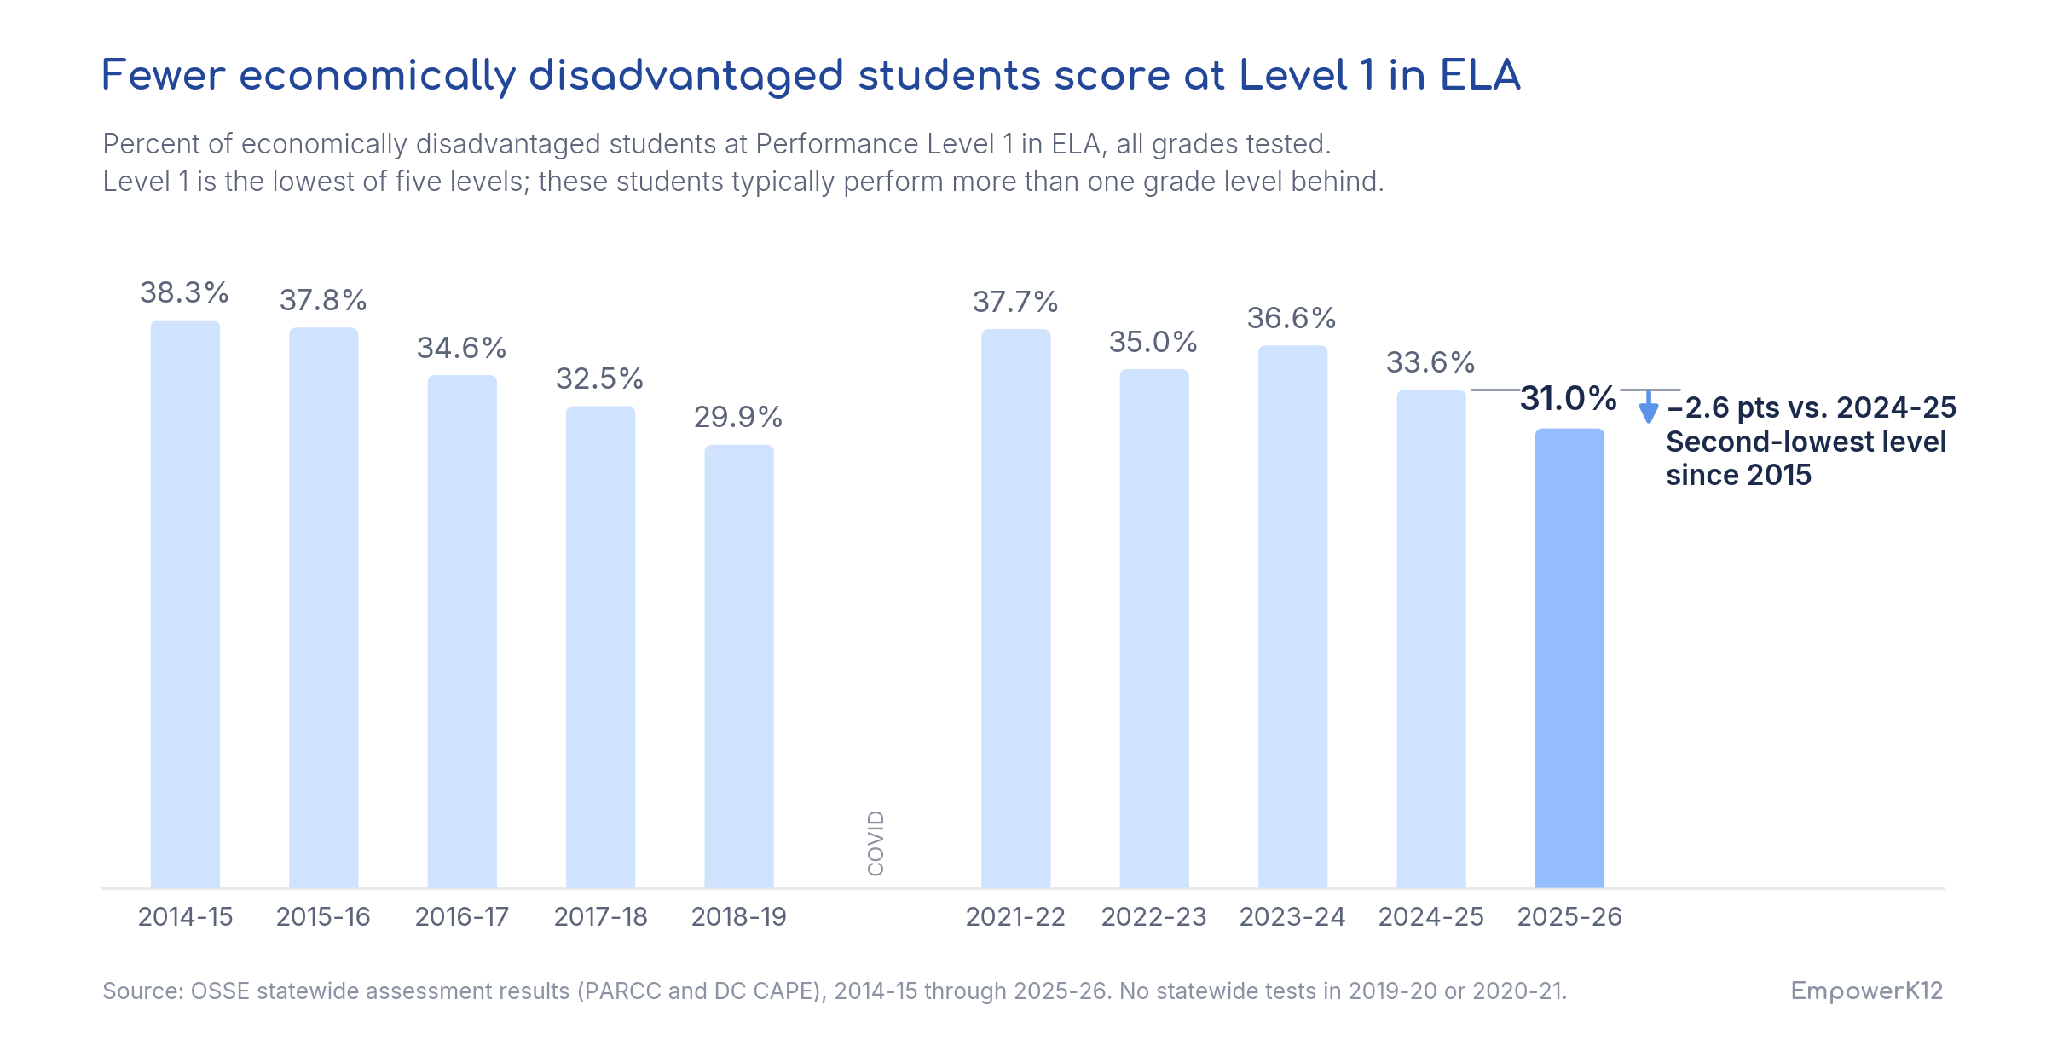
Students who perform at Level 1 on CAPE are typically multiple grade levels behind their peers. In 2026, there were 1,500 fewer students scoring at Level 1 in math, a historic single-year 13% decrease in the number of students furthest behind. The percentage of students at Level 1 in ELA dropped to the second lowest level since computer-based testing began in 2015.
Let’s dig in.
The share of students achieving Level 3+ on CAPE helps us understand how public schools are recovering post-COVID
State officials typically headline the share of students who meet or exceed grade-level expectations, a standard known as Level 4 (meeting or exceeding expectations) that signals students are on track for readiness at selective colleges. All students deserve the opportunity to graduate high school and compete for selective college admissions, the standard that CAPE 4+ represents. We also know every student needs adequate command of English and math to succeed in life regardless of postsecondary pathway, the standard that CAPE 3+ more closely represents and what educators most often correlate with being “on grade level.” In fact, the test developers originally called PARCC Level 3 “Adequate Command of Content“ to reflect career-ready expectations.
The pandemic hit the 3+ benchmark hardest. Proficiency rates fell further at 3+ than at 4+, and achievement gaps widened more at 3+ than at 4+. Monitoring both benchmarks, along with the percent of students at Level 1, lets us track whether all students improve, not only our higher performers.
Longitudinal math gains post-pandemic outpace the pre-pandemic trend
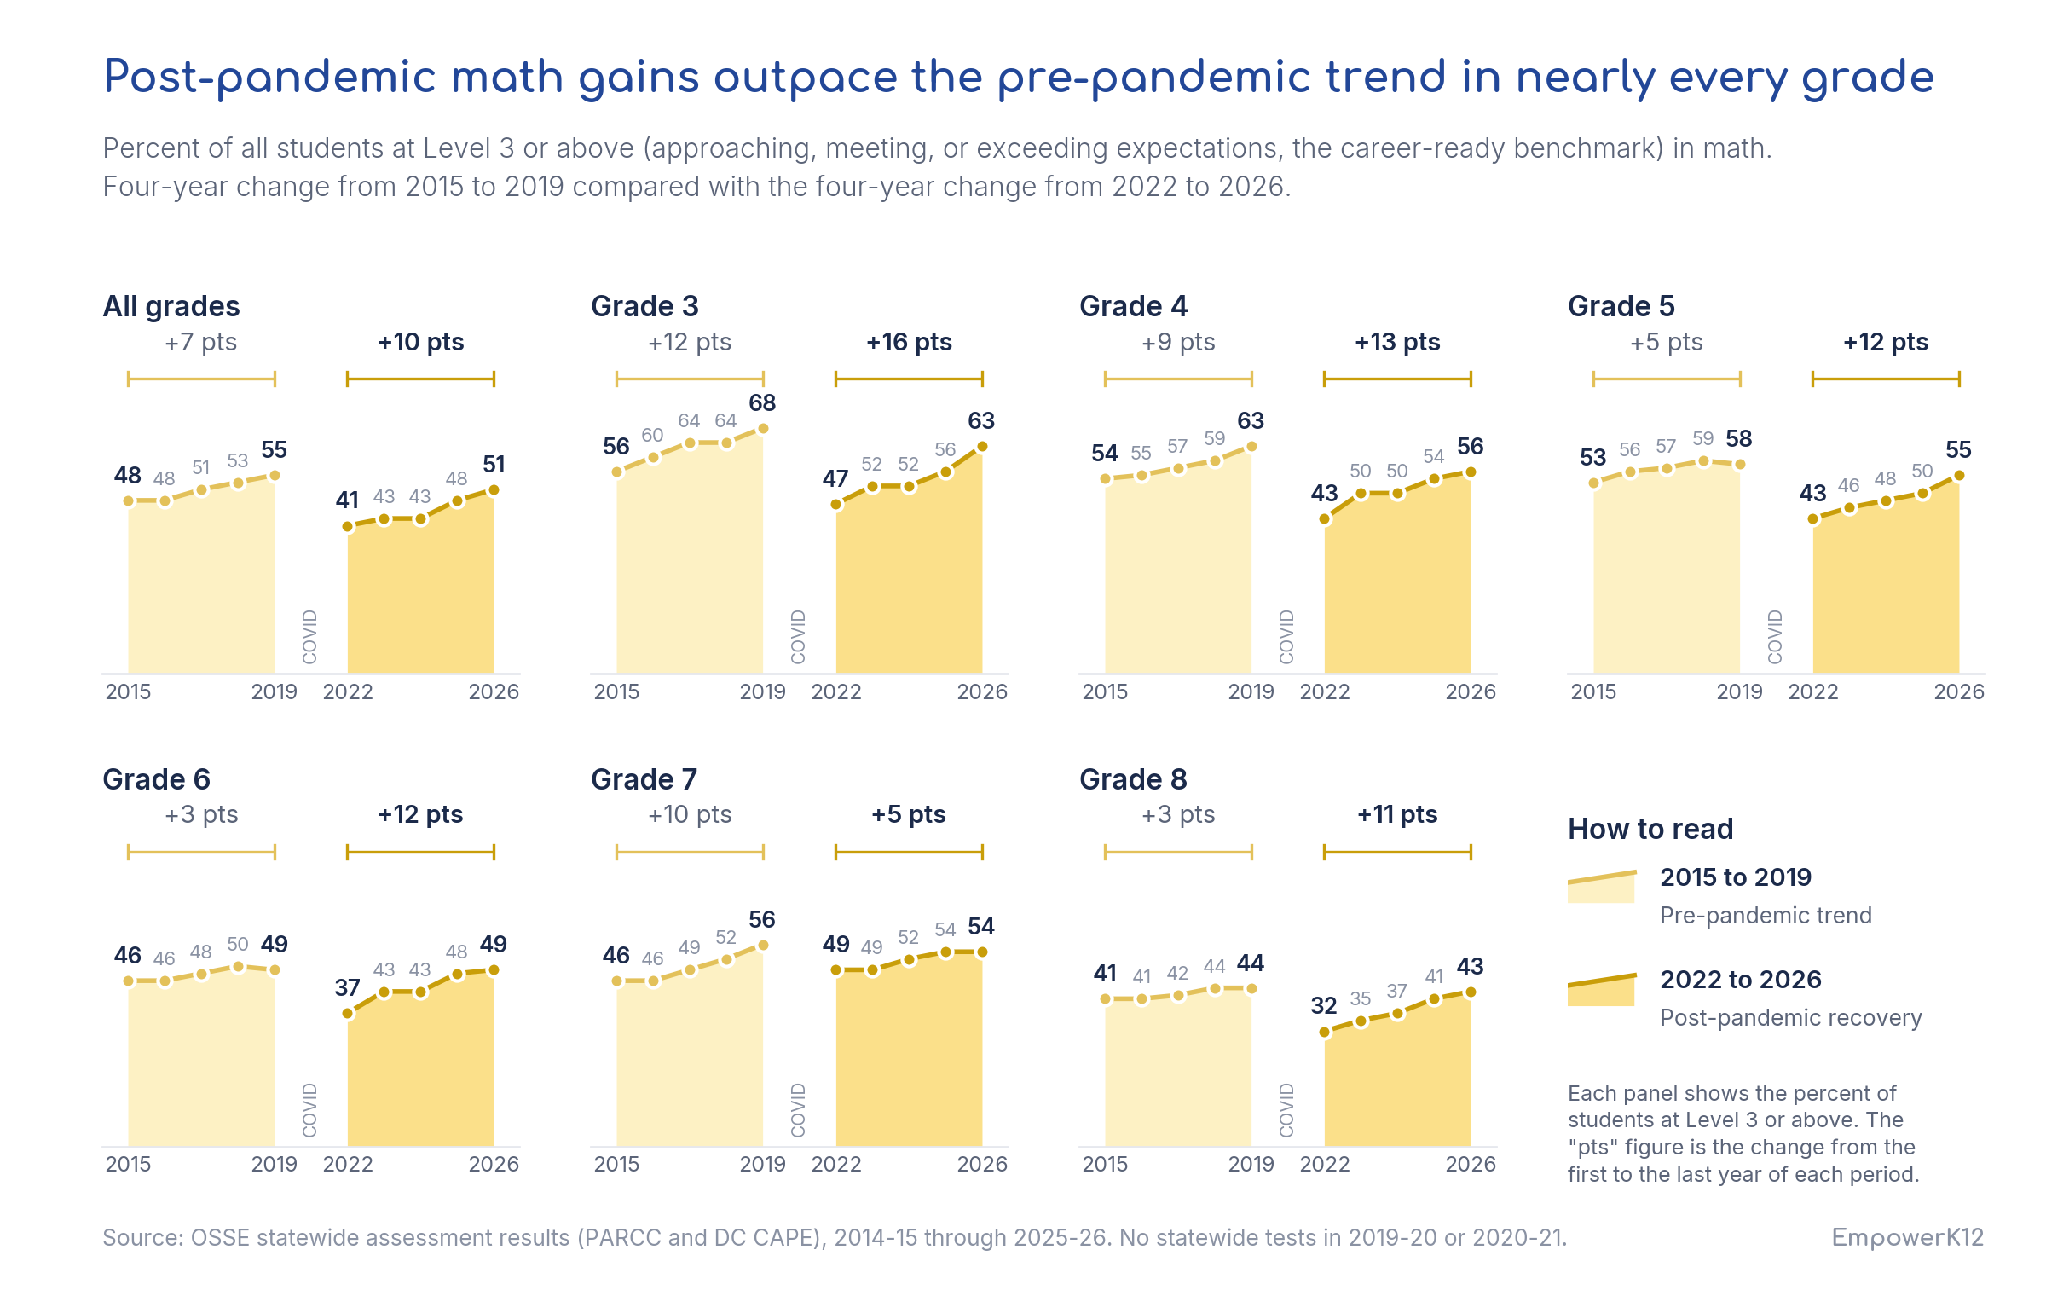
Between 2015 and 2019, the District earned a national reputation as one of the fastest-improving urban school systems in the country. The 2026 results show that the five-year, post-pandemic recovery in math demonstrated greater improvement than the five-year, pre-pandemic trend in nearly every grade. Statewide, the share of students at the career-ready benchmark in math rose 10 points over the past four years, compared with 7 points over four years before the pandemic. The grades that fell furthest in 2022 have recovered fastest. Third grade, which dropped 21 points after returning from school closures and virtual learning, regained 16 points. Seventh grade, which dropped the least, gained the least.
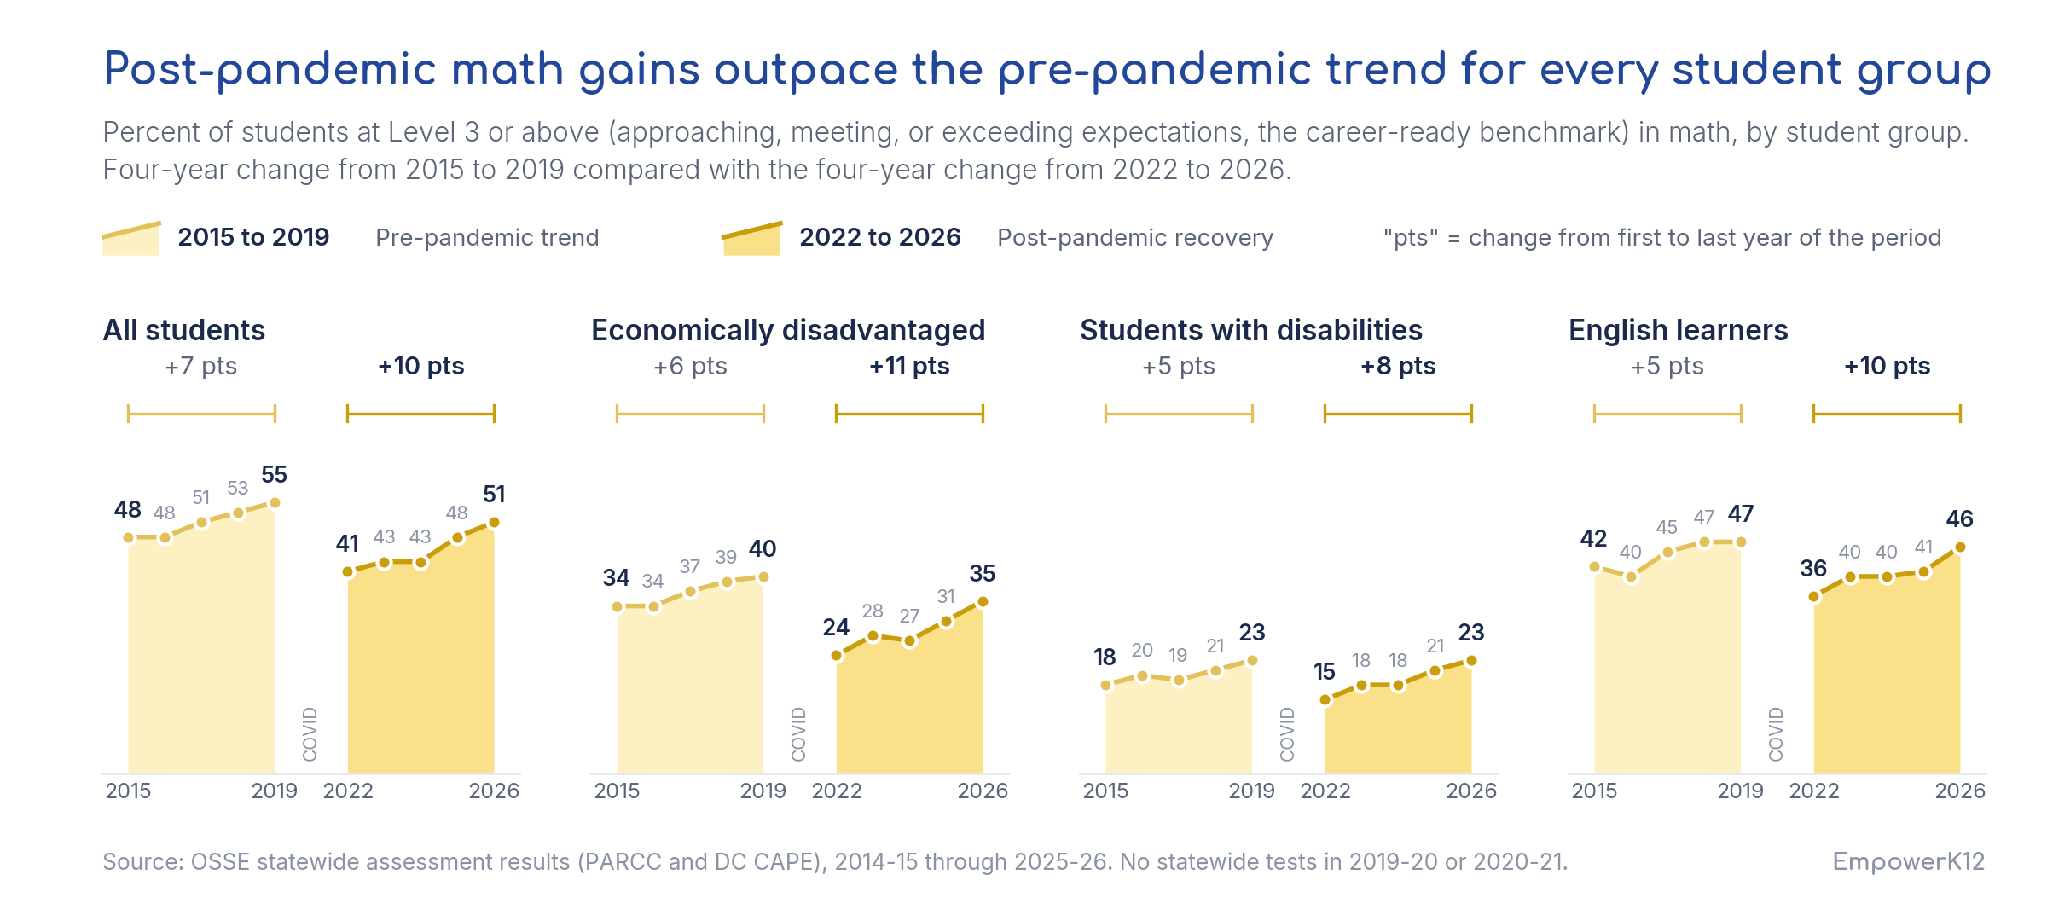
The same pattern holds for student groups. Economically disadvantaged students, who lost the most ground during the pandemic, produced annual gains at nearly twice the pre-pandemic pace. English learners recorded their largest single-year math gain of the recovery this spring.
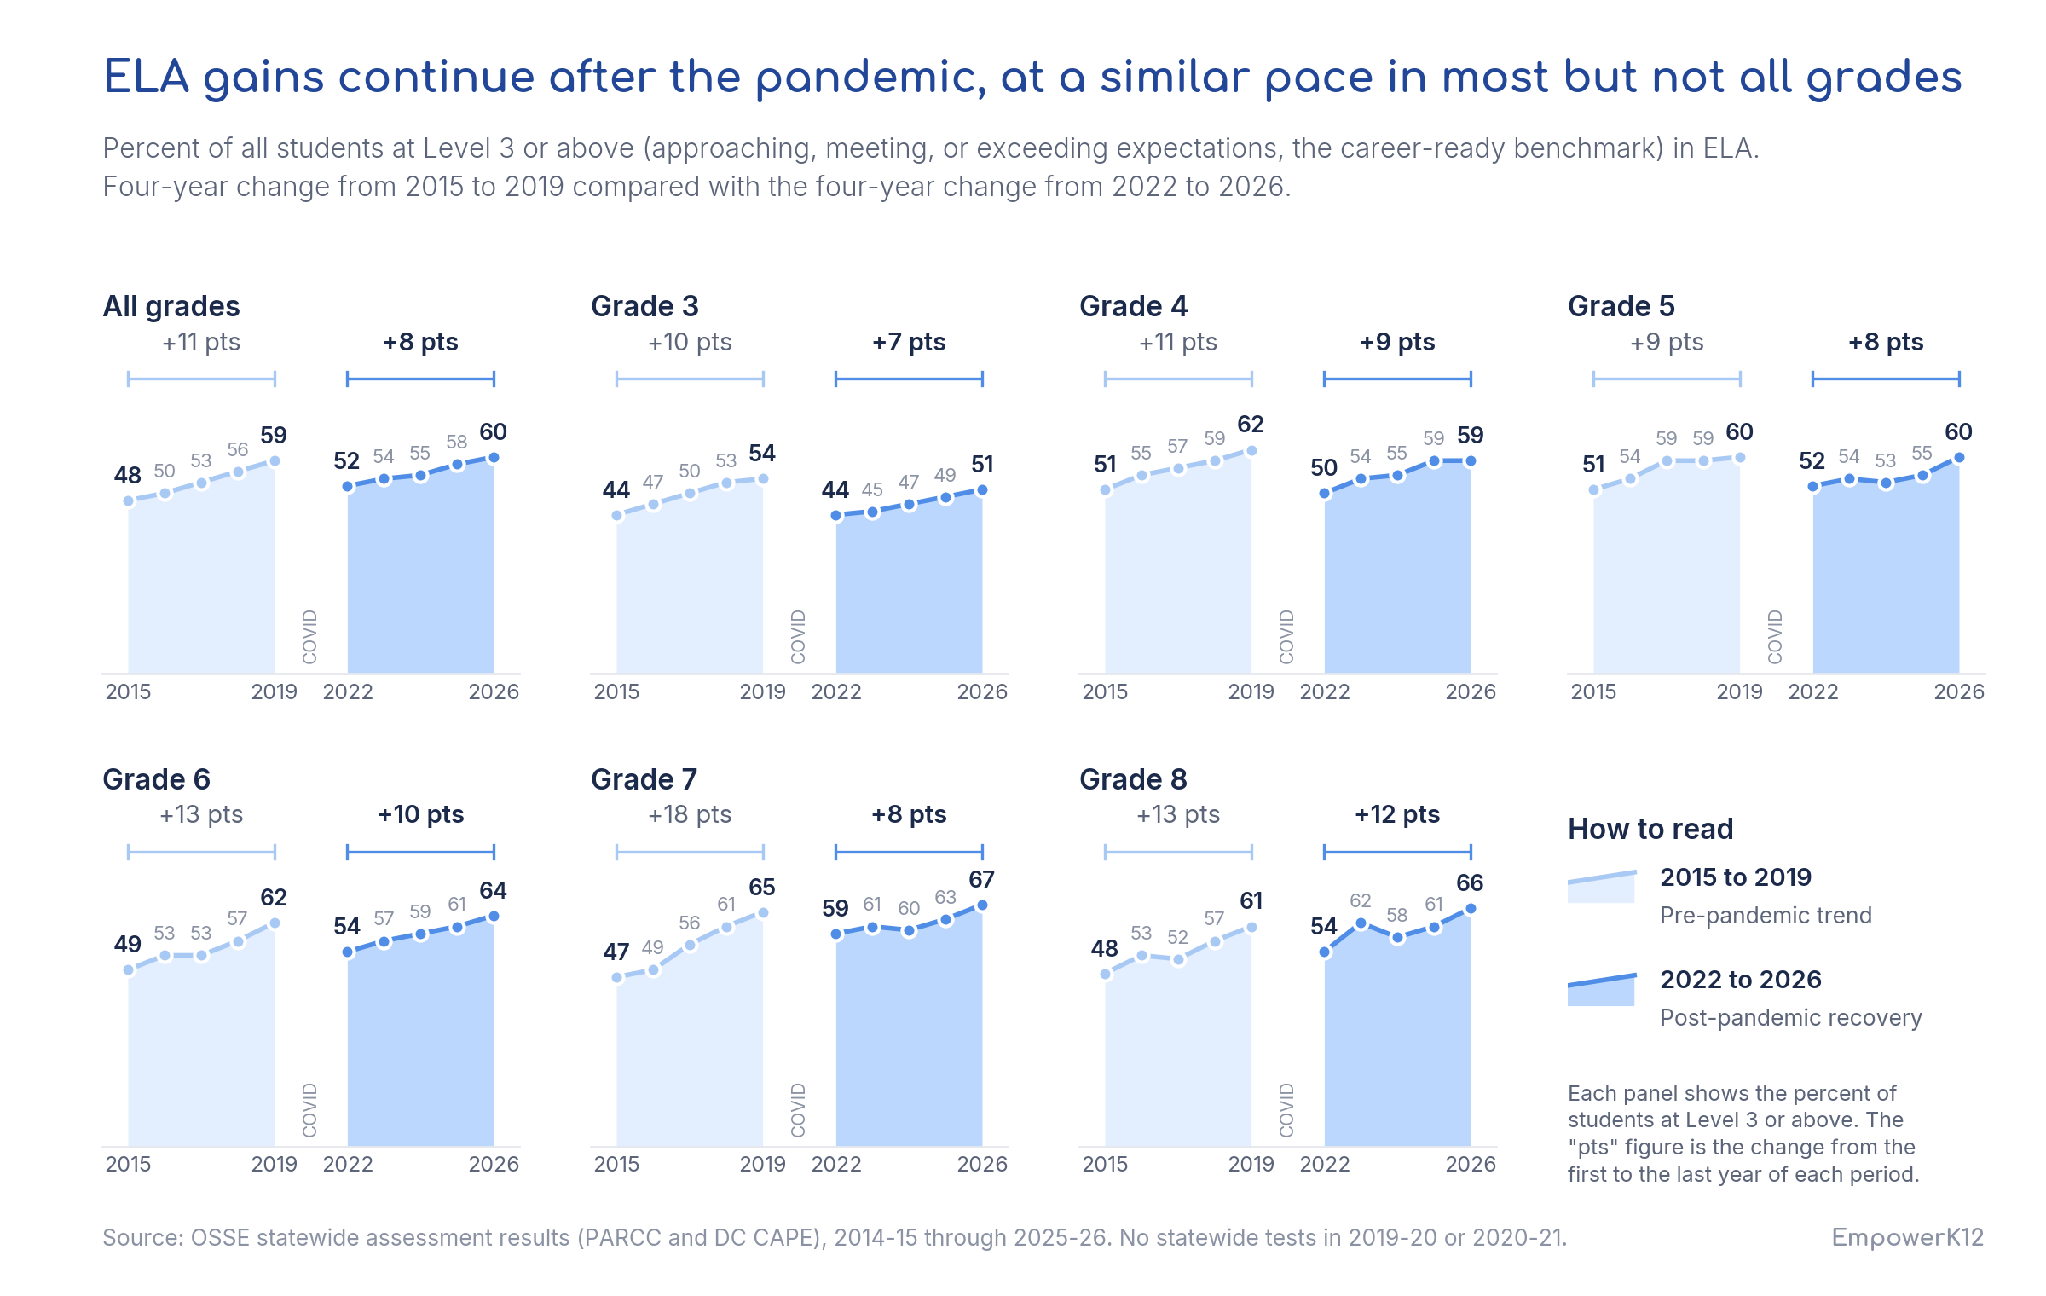
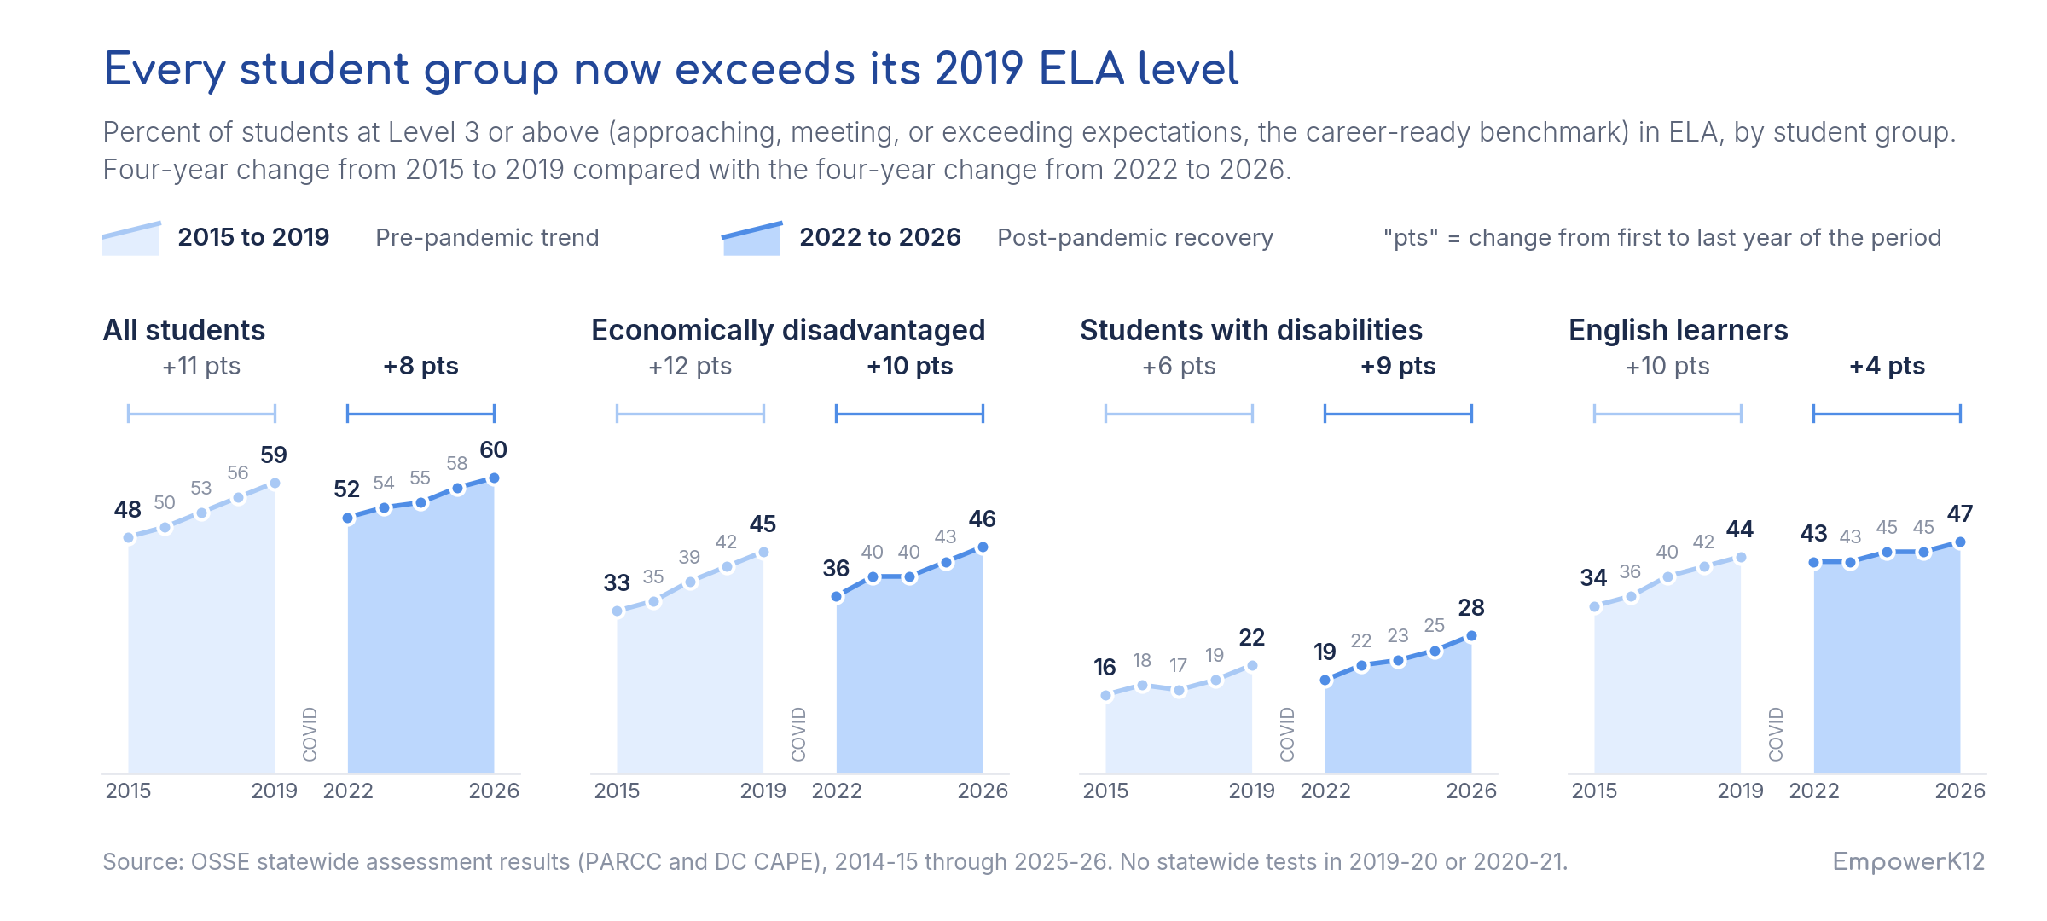
ELA gains continue at a similar pace, and every student group now exceeds 2019 performance levels
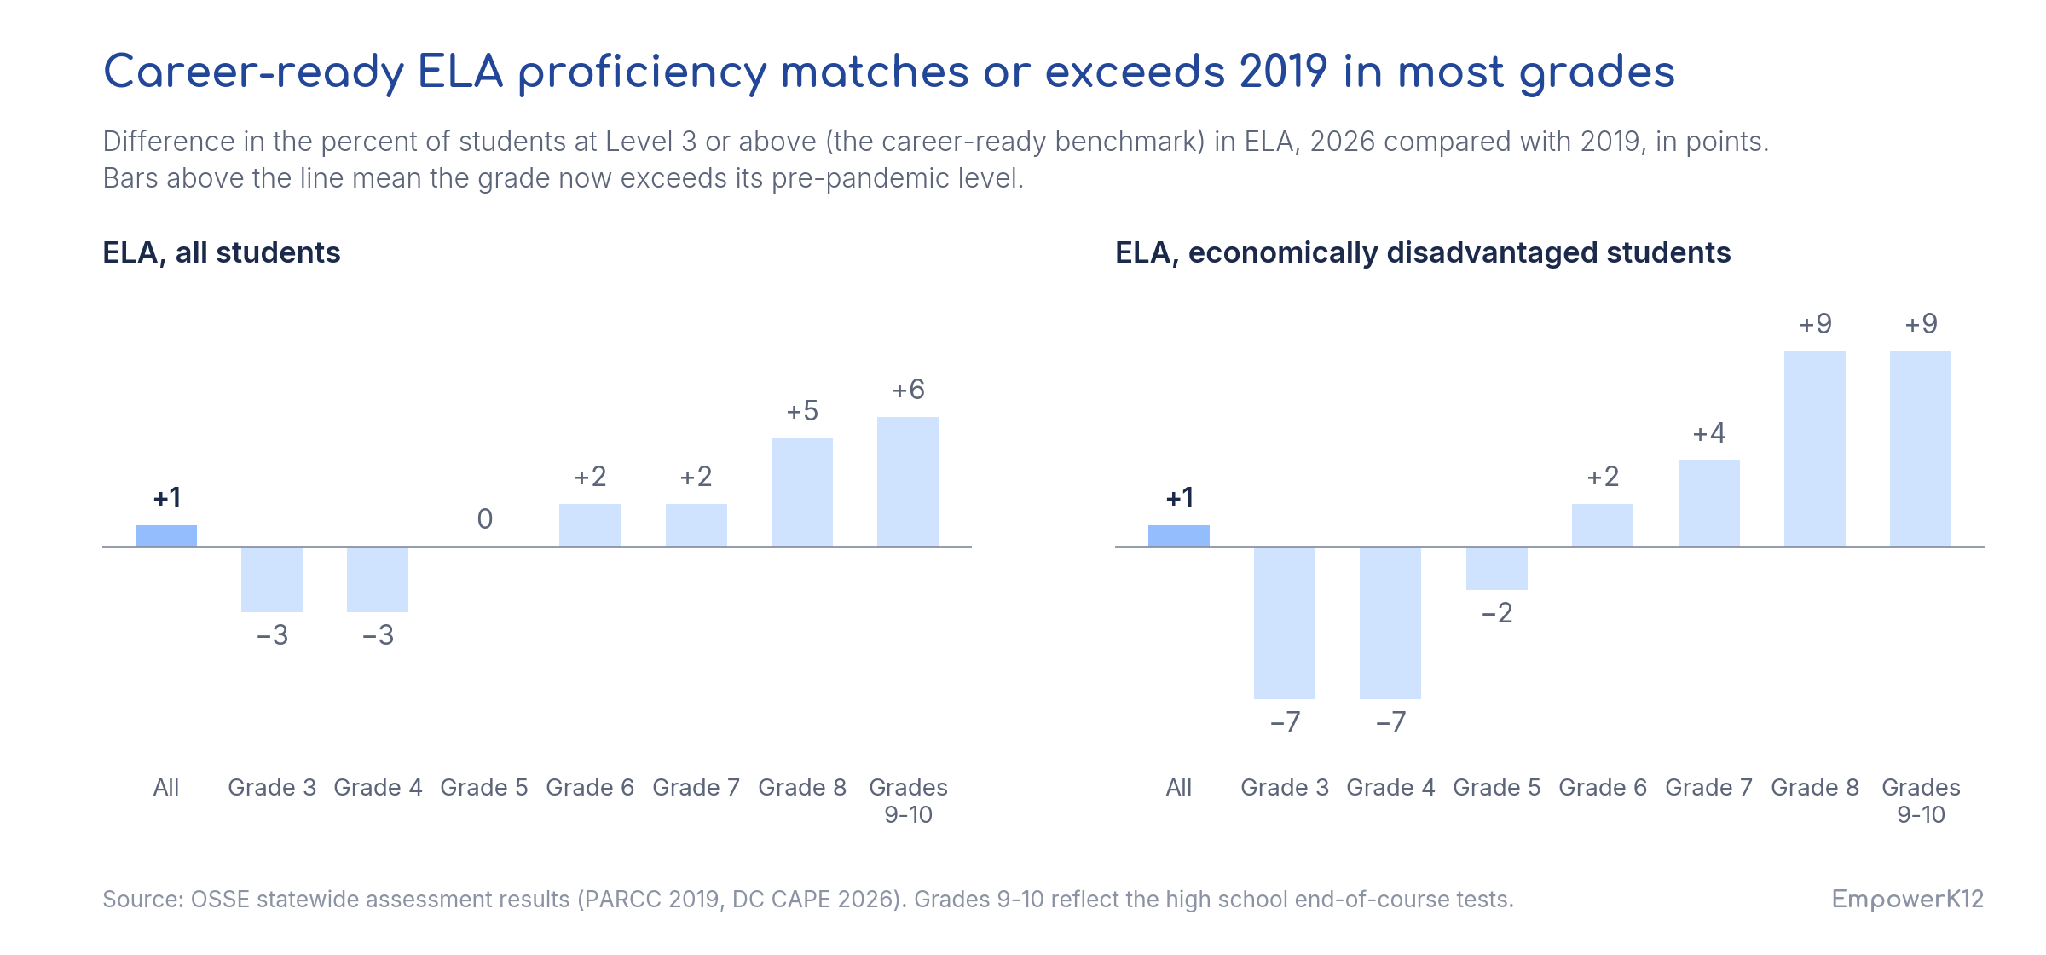
The pandemic’s negative impact on reading achievement was about half the magnitude of math, and gains since 2022 closely tracked the pre-pandemic pace in most grades despite starting at higher levels. Steady annual improvement means that for most grades and student groups, performance now exceeds pre-pandemic rates.
Fewer students score at Level 1 on CAPE
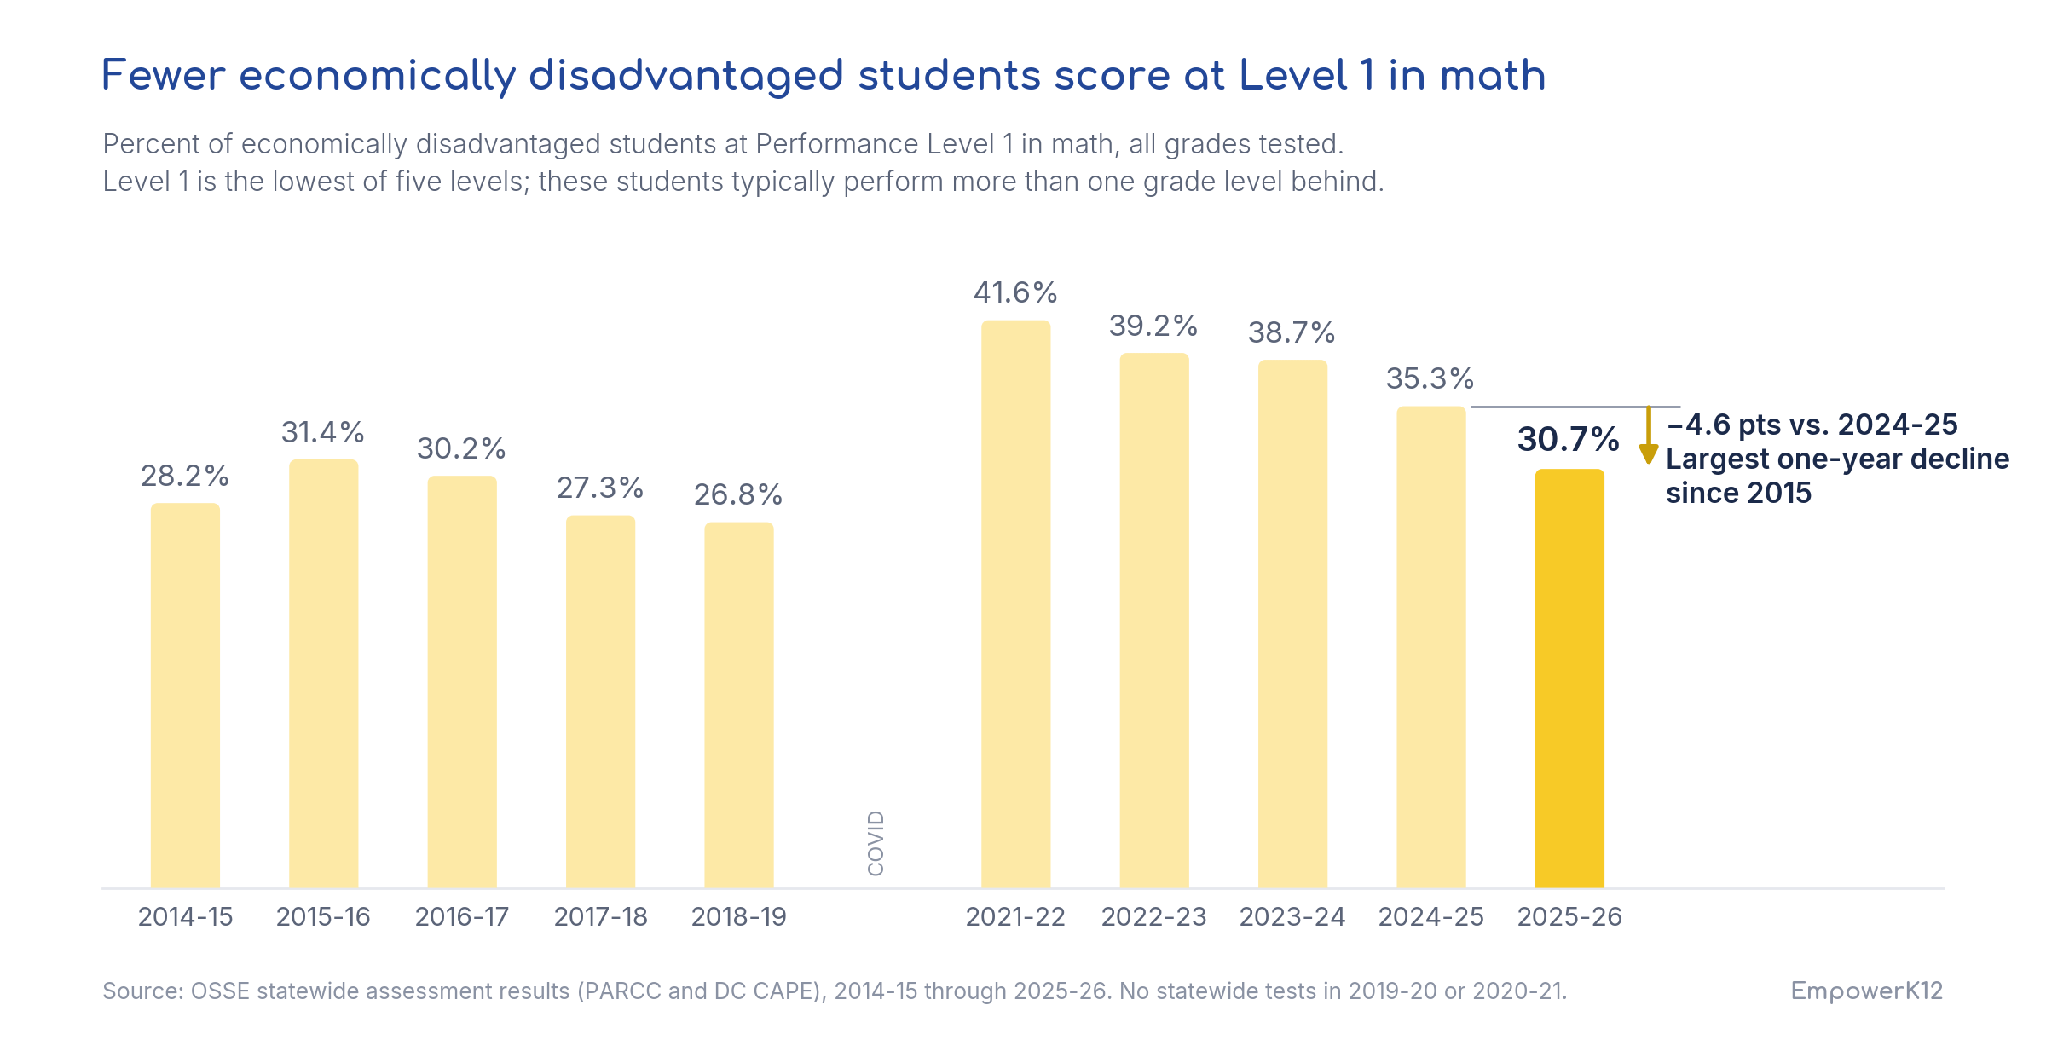
The share of students scoring at the lowest performance level—an often-overlooked measure—shows the depth and pace of academic recovery among students who are furthest behind. Students who score Level 1 in math, the lowest of five performance levels, are typically more than one grade behind. The share of economically disadvantaged students scoring Level 1 fell 4.6 points this year to 30.7 percent. That is the largest single-year decline in more than a decade of data; however, the rate remains 4 points higher than where it stood in 2019. At the current pace, the city will pass its pre-pandemic low next year. Across all students in math, nearly 1,500 fewer students in grades 3-10 posted a score that indicates they were multiple grade levels behind in math last year. In reading, there were nearly 1,000 fewer students at Level 1 than last year.
Economically disadvantaged cohort gains indicate a stronger system
Washington’s rapid demographic change raises an obvious question about its rising test scores: Are the schools improving, or is the student body simply changing? Over the past decade the District grew wealthier, and a rising proficiency rate for “all students” could, in theory, reflect who moved in rather than improvement in school performance. One way to answer it is to set the citywide numbers aside and follow a single group: economically disadvantaged students—those whose families qualify for public assistance, face homelessness, or are in the foster care system—who account for roughly half of DC’s tested population.
In this analysis, we follow two cohorts of economically disadvantaged students who sat in third and fourth grades in 2022 through seventh and eighth grade in 2026, pairing them with economically disadvantaged third and fourth grade students in 2015 through the seventh and eighth grades in 2019. This analysis has limits because the cohorts track grade levels, not individually matched children, and families move in and out of the District each year.
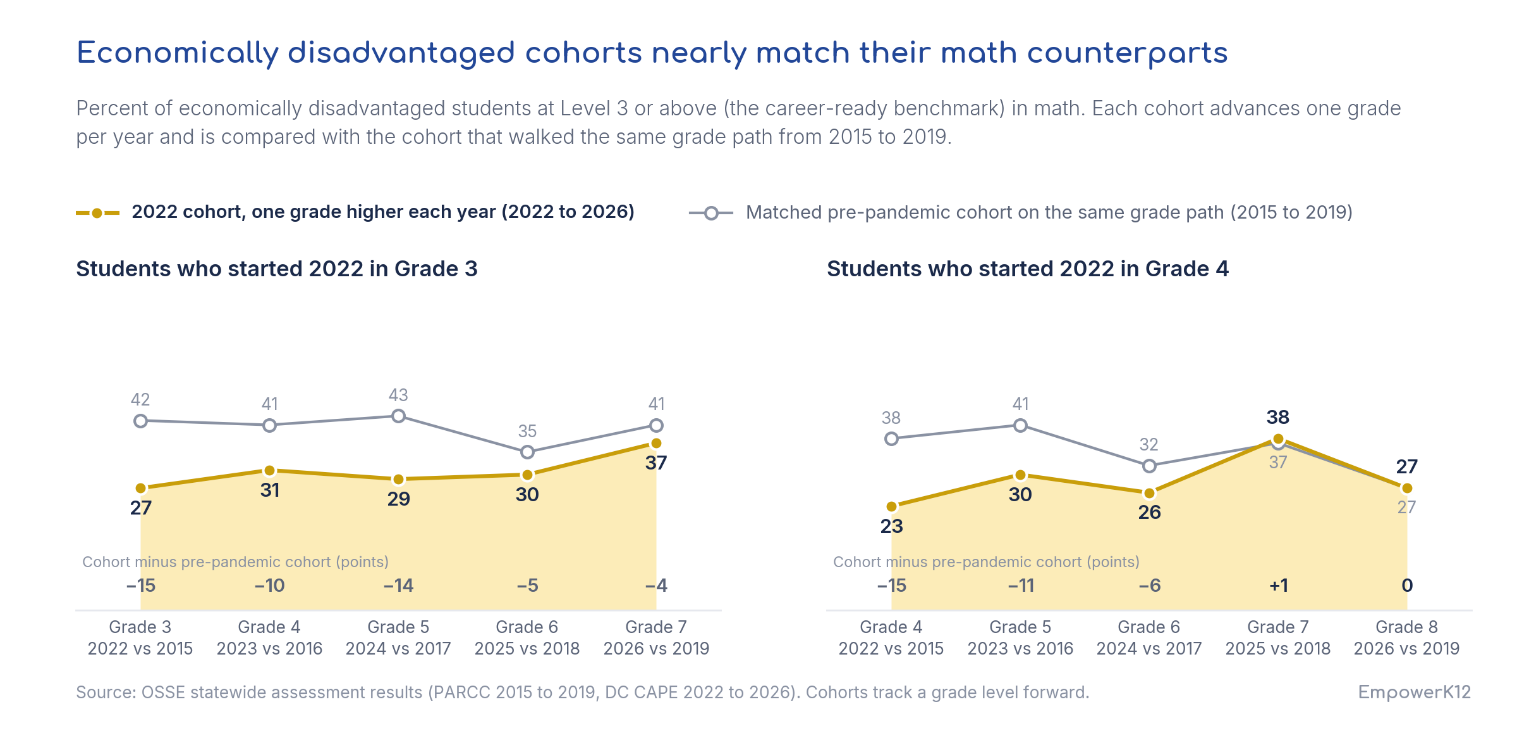
Consider math first. Before the pandemic, students tended to lose ground on average as they aged. The 2015 third graders started with 42 percent at the career-ready benchmark and finished seventh grade at 41 percent; the 2015 fourth graders slid from 38 percent to 27 percent by eighth grade. That pattern, a slow erosion of math proficiency from elementary school into middle school, prevailed in the District, as in many cities.
The pandemic cohorts started far behind those benchmarks, 15 points behind in both cases, a measure of how much the virtual year and a half cost the city’s poorest children. The 2022 third graders climbed from 27 percent to 37 percent over four years, a gain of 10 points on a path where their pre-pandemic peers lost one, and the 2022 fourth graders gained 4 points compared with their predecessors who lost 11.
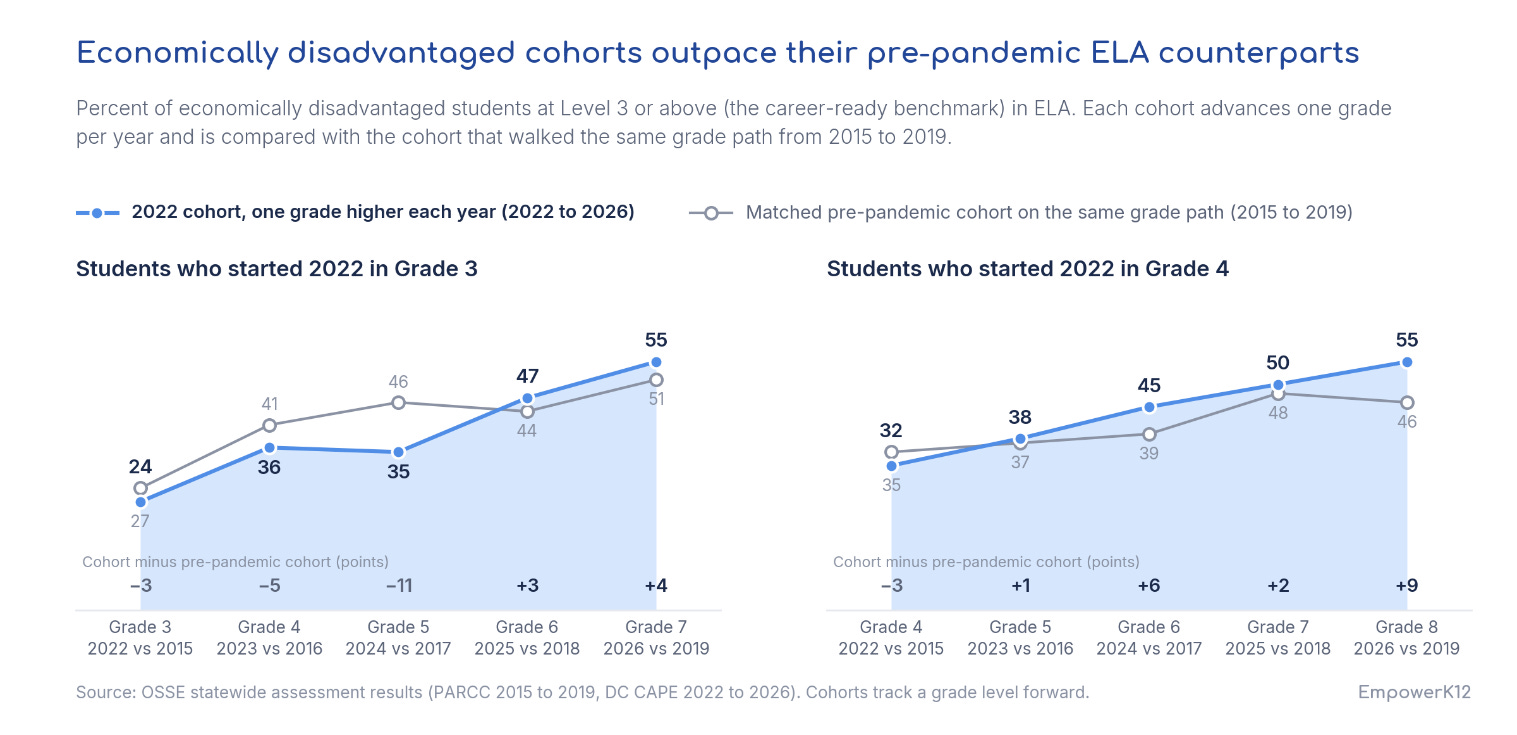
Reading tells the same story with a stronger ending. Both pandemic cohorts started 3 points behind their pre-pandemic counterparts and finished ahead: the 2022 third graders by 4 points as seventh graders, the 2022 fourth graders by 9 points as eighth graders. Fifty-five percent of economically disadvantaged eighth graders now read at the career-ready benchmark, compared with 46 percent for the matched group in 2019. Over four years, the newer cohorts grew by 31 and 23 points; the older ones grew by 24 and 11.
What changed between 2015 and 2022? The District trained thousands of teachers in structured literacy, built a high-impact tutoring program that reached more than 4,700 students last year, and directed additional funding to the schools serving the highest concentrations of poverty. The cohort results suggest those investments work.
Students in pre-k and kindergarten during the COVID virtual year are not progressing as quickly as older peers
The strong recovery picture looks different for the city’s youngest test takers. Last year’s upper elementary students were in PK3, PK4, and kindergarten during the virtual year, missing out on critical in-person experiences that build early number sense, vocabulary, and classroom routines. In math, third grade sits 5 points below where third graders in 2019 performed, and fourth grade sits 7 points below. Among economically disadvantaged students, the shortfall grows to 9 and 10 points. Grades 6 and above, by contrast, sit within 2 points of 2019 in math and above 2019 proficiency rates in reading.
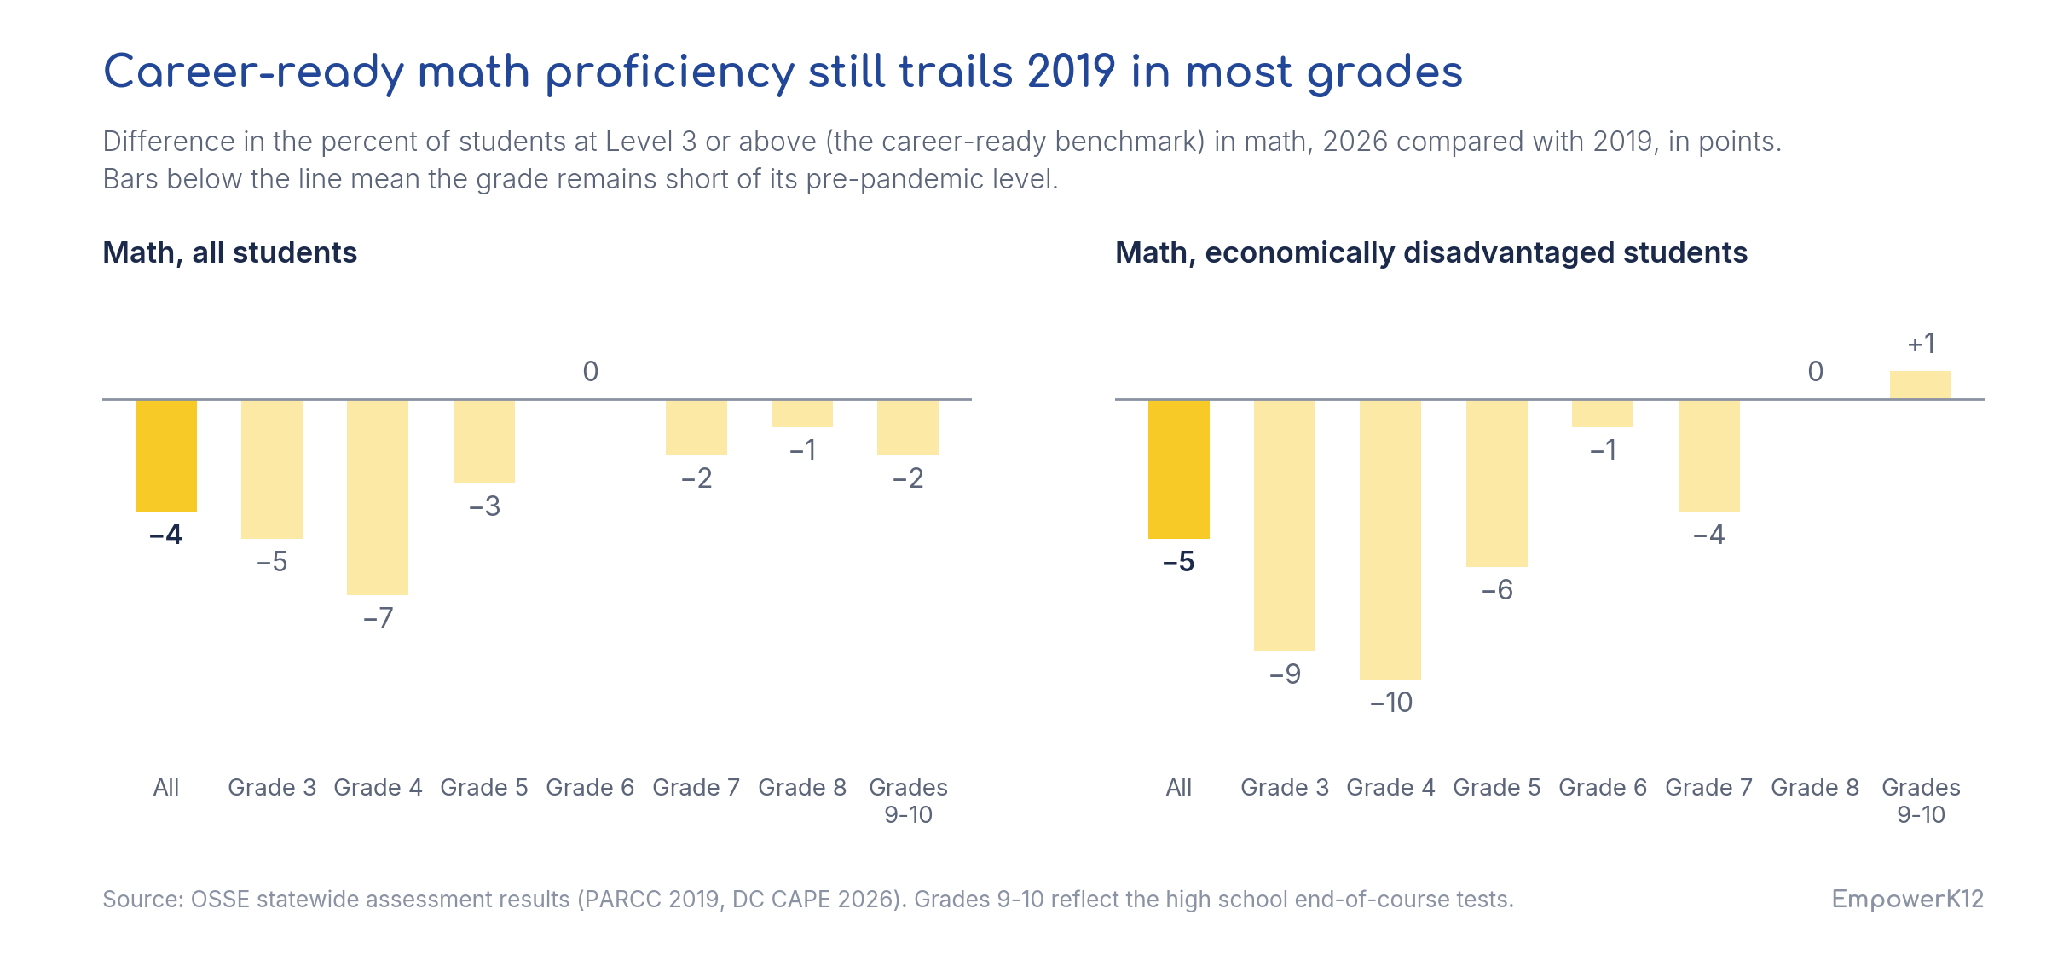
Early numeracy deserves the same citywide focus that structured literacy received, and the Capital Math Collective, a $20 million public-private partnership built on the Math Task Force recommendations, arrived at the right moment. High-impact tutoring, teacher training in evidence-based math practices, and family engagement in math activities outside of class will help continue moving the numeracy needle forward.
Equitable progress continues with narrowed gaps, shrinking correlation between school poverty and performance
Achievement gaps at the career-ready benchmark narrowed for most student groups since 2022, for most groups since 2022, a direct result of the students who fell furthest gaining the fastest. The gap between Black and White students at the career-ready benchmark in math fell 6 points, to 54, and the gap between Hispanic and White students also fell 6 points, to 42. In reading, the Black-White gap fell 6 points to 44. Those gaps remain wide, and two grew: the math gap for students with disabilities and the reading gap for English learners.
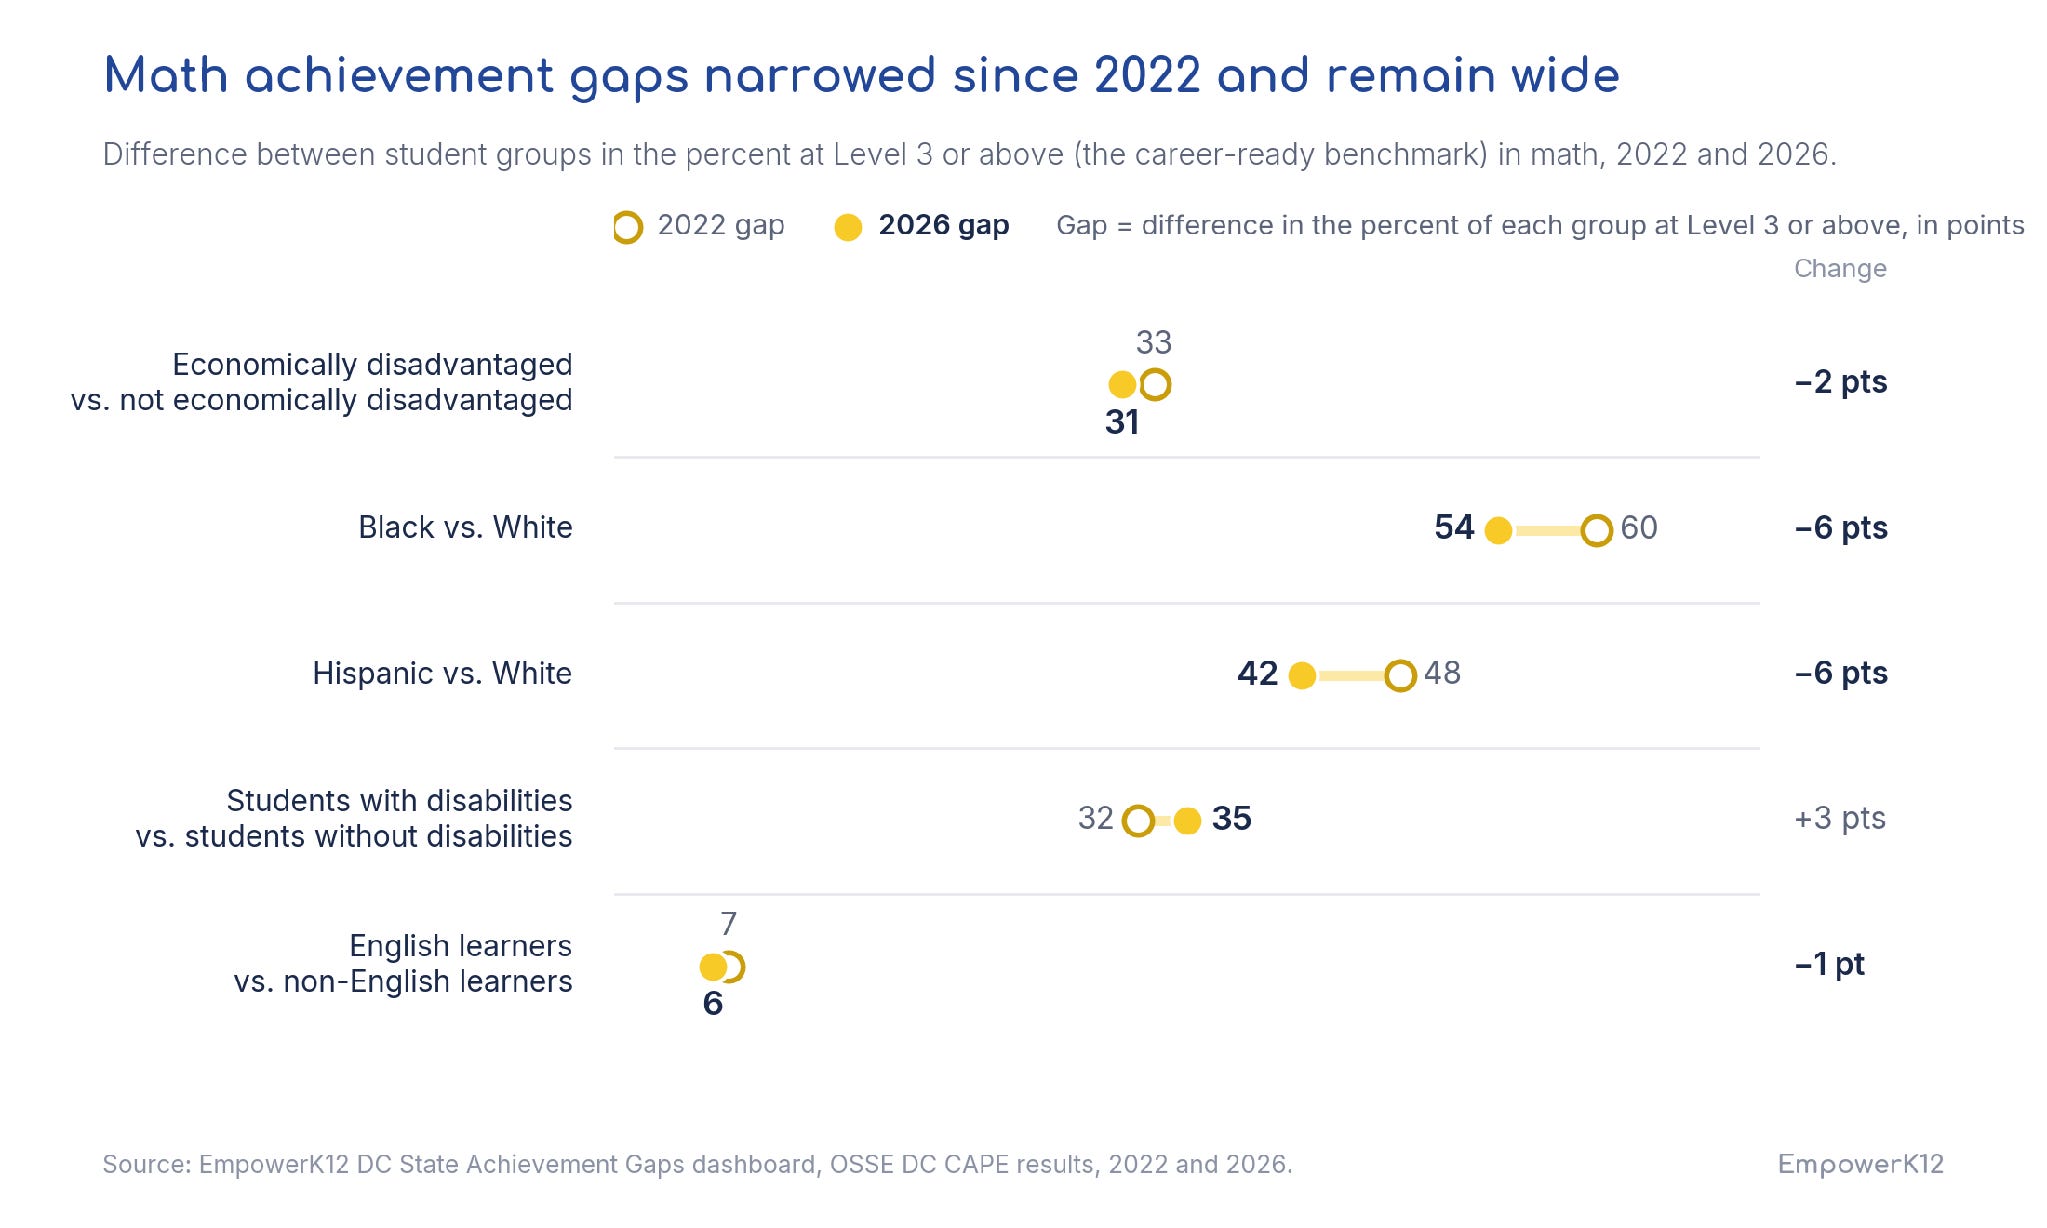
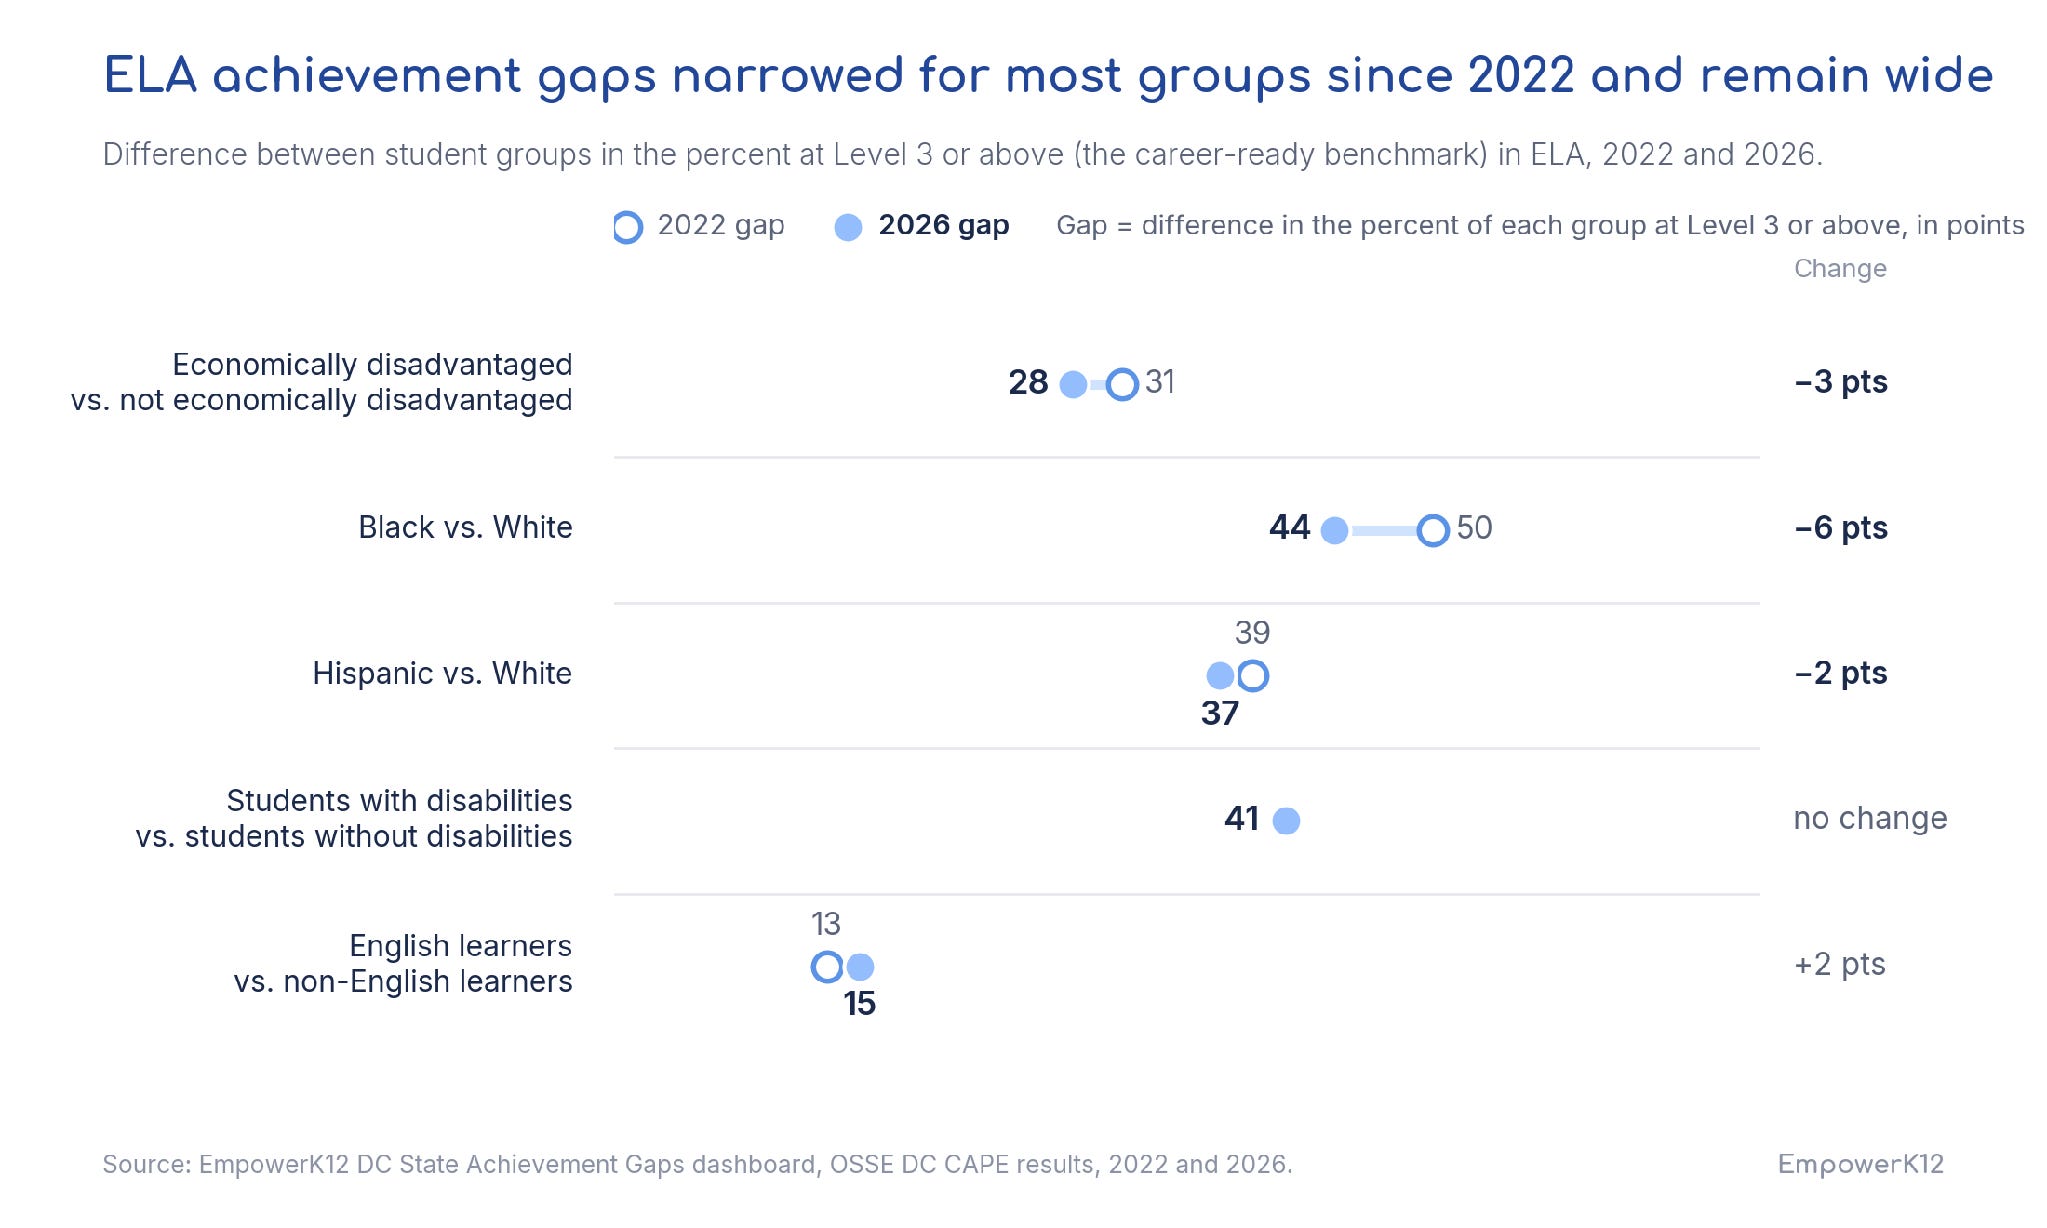
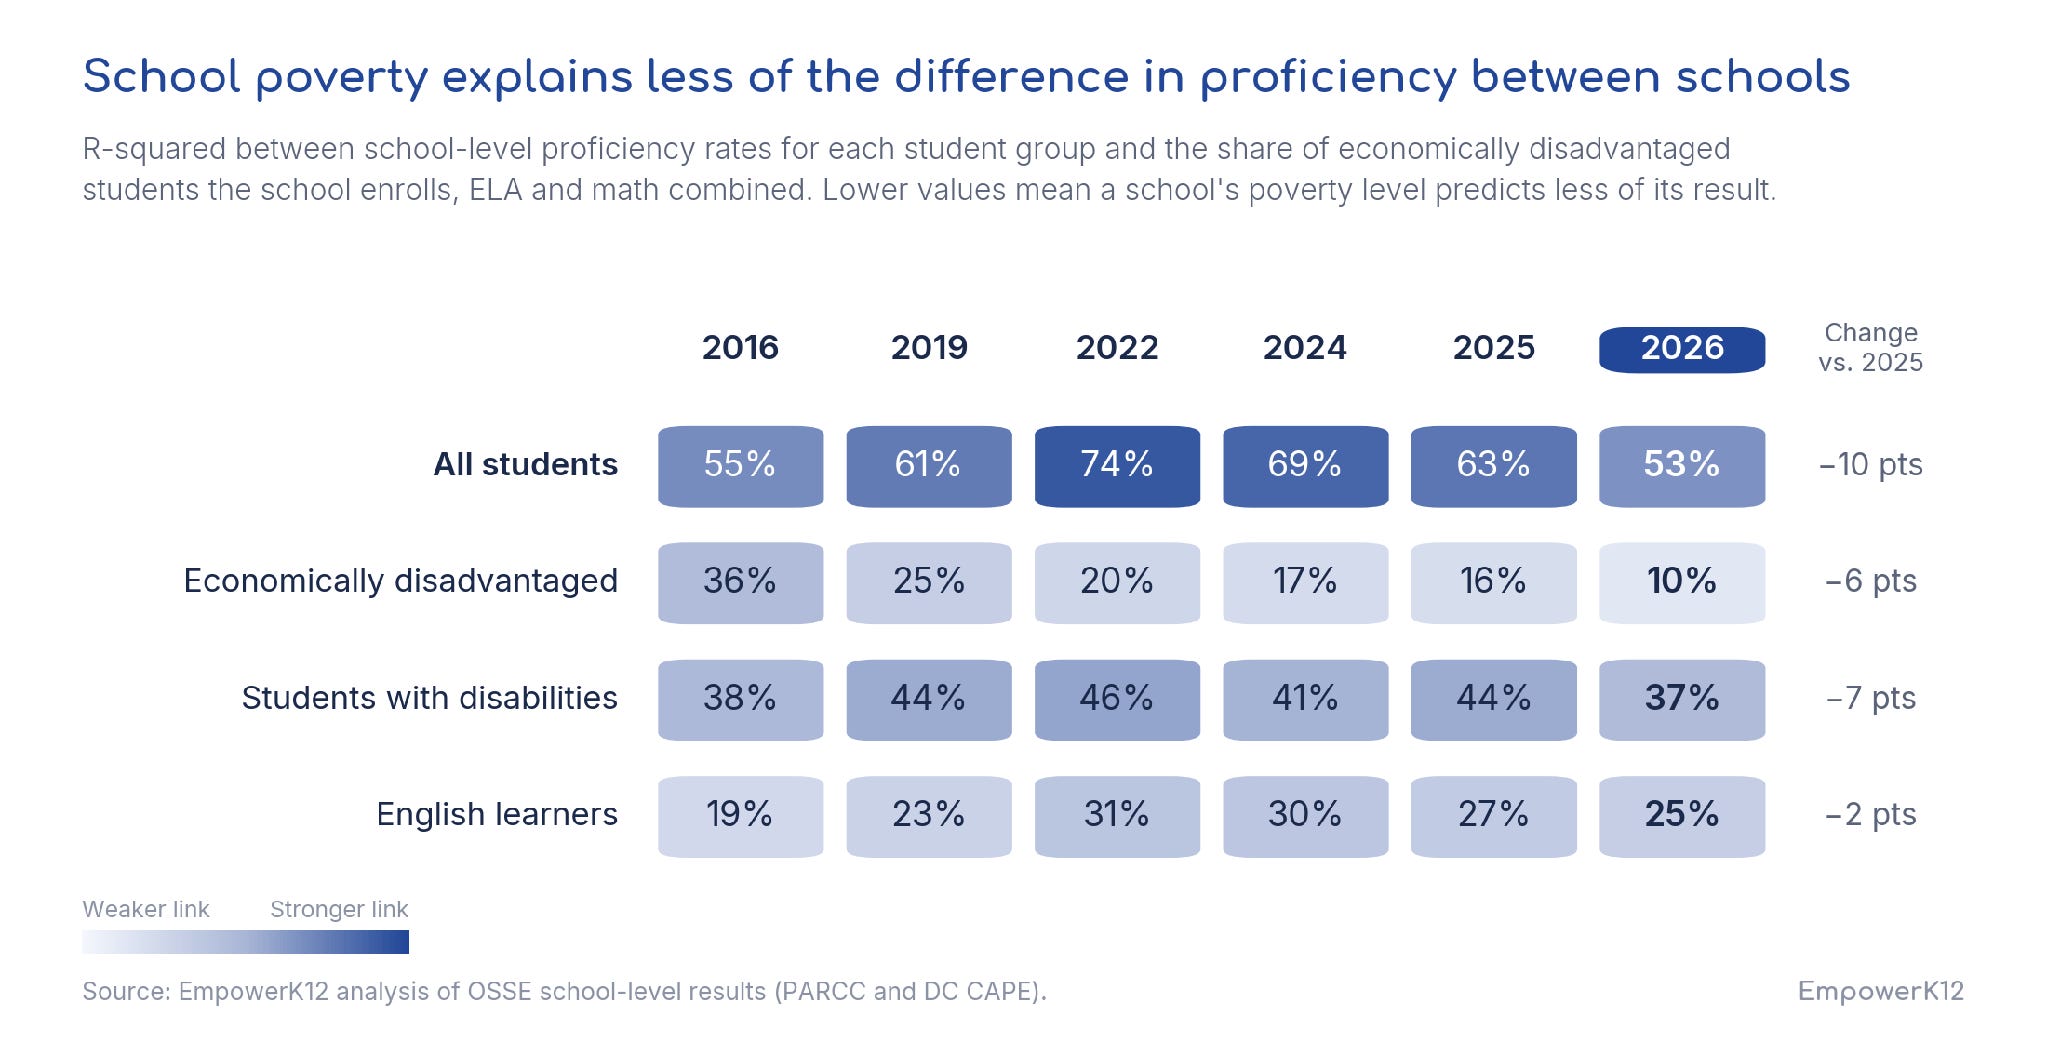
The nonprofit I run, EmpowerK12, also tracks how much a school’s poverty level predicts its results. A weaker relationship indicates that more schools serving high-poverty communities produce strong outcomes. In 2022, the share of economically disadvantaged students a school served explained nearly three-quarters of the variation in school proficiency rates. That figure has fallen every year since and now sits at 53 percent, below the previous record low in 2016. For economically disadvantaged students themselves, school poverty now explains about a tenth of the variation in their results, the lowest figure in any year of the analysis.
Whittier Elementary in Ward 4 is a particular stand-out this year for the results of economically disadvantaged students. More than half of economically disadvantaged students at Whittier (54%) achieved at the college-ready (4+) benchmark—outperforming the proficiency rate of economically disadvantaged students in DC’s selective-enrollment schools—and nine in ten economically disadvantaged students met the career-ready (3+) benchmark, which is higher than the average proficiency rate of all students in Ward 3, the city’s most affluent.
It’s worth noting that DC’s per-pupil funding formula is considered one of the more progressive in the country, due to providing a high funding weight—calculated as a percentage of the base weight that all students receive—for high-need students. Mayors Gray and Bowser and the DC Council have all taken specific actions to make DC’s approach to school funding more equitable over the last decade and a half—by adding the funding weight for at-risk students, increasing the base above the inflation rate, and adding a new weight for schools serving high concentrations of at-risk students.
The path forward
The 2026 results confirm that many of the District’s strategies work, and the task at hand is scale and maintaining focus.
Continue scaling what works, including classroom instructional supports and high-impact tutoring. OSSE served more than 4,700 students and CitySchools Collaborative reached 12,610 students through high-impact tutoring (HIT) in 2025-26, with 69% of those students from economically disadvantaged families and a majority with baseline test scores in the bottom quartile. OSSE analysis found that students who received at least 20 hours of tutoring in reading saw more favorable score changes across grade bands. In math, our own research found that DCPS and public charter students who met high-impact tutoring dosage levels demonstrated an additional 59 instructional days of growth compared with peers who started the fall at the same performance level and did not receive HIT. Stanford researchers also found that DC students were more likely to attend school on days they were scheduled for tutoring. Thousands more students need access to HIT to help them get more at bats and catch up with their peers.
Bring structured literacy’s playbook to early numeracy. The District trained thousands of educators in the science of reading, and ELA recovery followed. A similar initiative is needed for math. DCPS has demonstrated strong improvement in math proficiency, especially at elementary schools East of the River, by taking a coherent approach to training everyone in evidence-based math instruction training from instructional superintendents to principals to teachers. In early elementary classrooms across DCPS, math instruction and intervention blocks follow a standard protocol informed by research and the Eureka Math Squared curriculum. Teachers and aides target intervention and small group coaching based on how students perform on daily lessons and weekly math skills assessments.
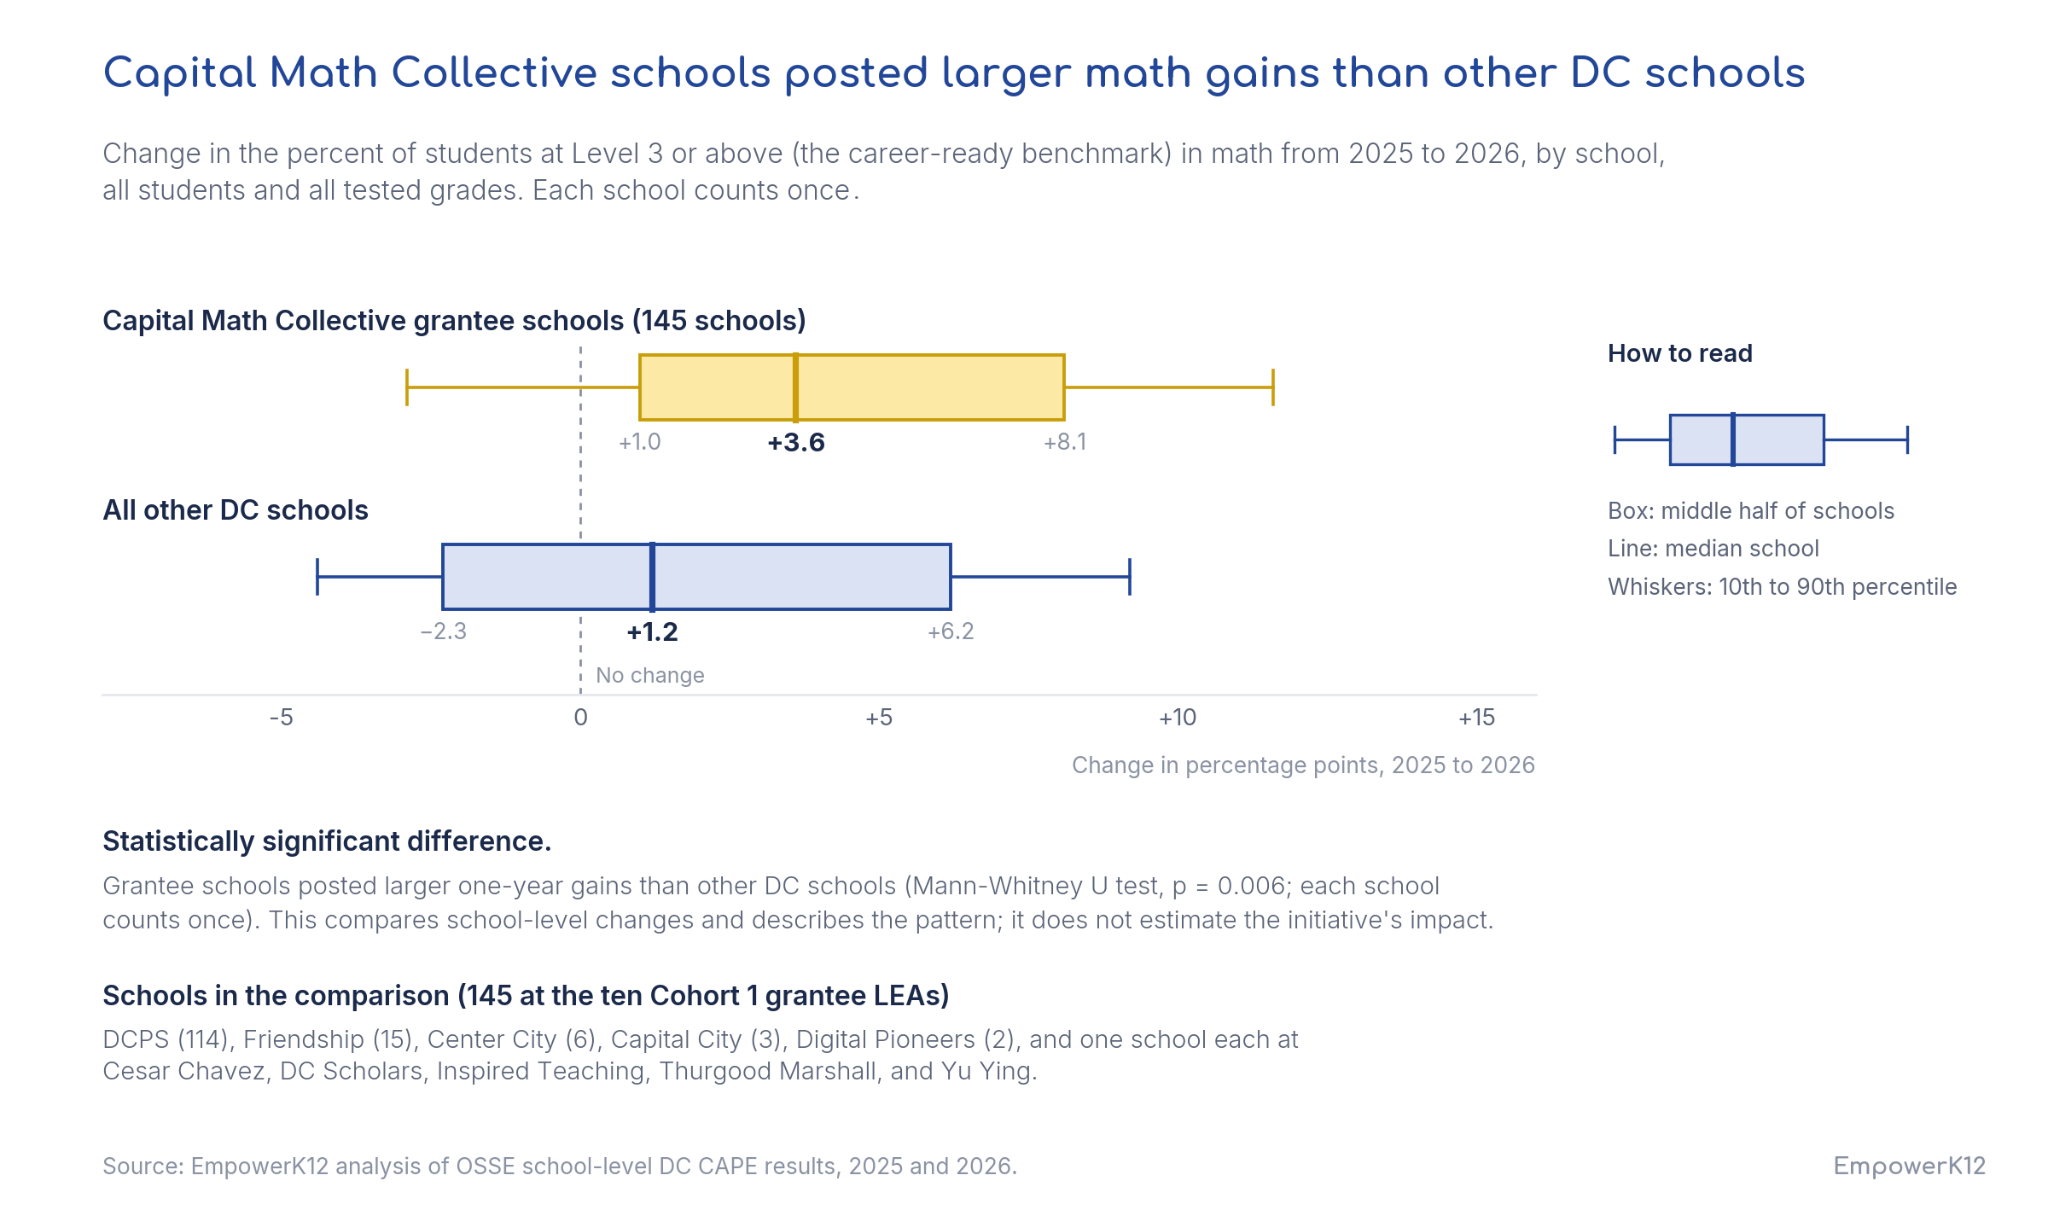
The Capital Math Collective, a privately funded $20 million citywide initiative, helps DCPS scale teacher support and provides more than $2 million in grants to 23 charter schools for similar professional development and instructional coaching for math teachers. After year one, of the two-year grant, DCPS and charter school grantees outgained non-grantees in math 3+ proficiency from the prior year, 3.6 percentage points for grantees to 1.2 points for non-grantees, a statistically significant difference (p<0.01).
DC should ensure all DCPS and public charter schools have access to evidence-based math instructional strategies by developing a robust math instructional leader network, either within a government agency like OSSE or by adding government funds to public-private partnerships like the Capital Math Collective.
Maintain investment levels. The equitable funding formula and the investments in tutoring and teacher development created this momentum, and sustained funding will carry it forward.
Four years of post-pandemic gains have shown what DC’s public schools can do when citywide strategy, funding, and instruction pull in the same direction—the next four will show if our public officials want to continue and accelerate that progress.
Explore the complete 2026 DC CAPE results through EmpowerK12’s data dashboard to learn more about how your child’s school or neighborhood school performed. Also, save the date for EmpowerK12’s forthcoming 10th Anniversary celebration of Bold Performance Schools and release of our annual report about what works in our city’s best schools at the end of October.
For ten years, DC used a test called PARCC (Partnership for Assessment of Readiness for College and Careers) that originated during the Common Core era as a multi-state assessment consortium, with the goal of comparing data across states; this year was, the tenth and final set of results from the PARCC version of the/CAPE test. I (in 2027, students will take a new version of the test, SBAC/CAPE Next—still aligned to state standards but with a computer-adaptive format, meaning the test questions get harder or easier based on how students answered previous questions tests).

I really enjoyed this piece - it's great to see DC students improving over time. I work for the Washington Urban Debate League, supporting debate teams at about 100 schools in the DMV, and working with about 600+ students at DC public and charter schools. See: https://urbandebatewashingtondc.org/. We'd love to connect with Josh and talk about DC education and enrichment programs like ours.
Extremely cool results. Something I think is very good in a place like DC is for the public education system to broadly support the kids of a very wide variety of folks from a swath of economic and educational backgrounds. Performance of this sort ensures that such a thing is possible.