



On Oct. 16, the D.C. Council held a hearing on options to raise revenue. During this hearing, several tax advocates argued that D.C. should enact tax increases that would make its tax code more progressive. For example, Nick Johnson of the Institute on Taxation and Economic Policy (ITEP), a left-leaning think tank, claimed that although D.C. has made its tax system more progressive recently, “the wealthiest 5 percent still pay taxes at a lower effective rate than most other income groups.” Other groups have repeated this talking point.
The problem? This talking point is based on an ITEP model that uses at least one major non-standard assumption that we think understates the progressivity of D.C.’s tax system.
Using more standard assumptions, we find that D.C.’s tax system is unambiguously progressive. The top 5 percent and top 1 percent of households pay the highest effective tax rates, while the bottom 20 percent of households receive net refunds from the D.C. government.
Measuring Tax Burdens
The argument that ITEP and others are making is based on “distributional analyses” of D.C.’s tax system. These analyses typically group households by income to determine what share of income households at different income levels pay in taxes.
Distributional analysis can sometimes be more art than science. In some cases, the incidence of a tax can be straightforward: households subject to individual income taxes bear the burden of that tax. Other taxes, however, may have more complex incidence. Business taxes, for example, may be shared between owners of the business and its workers.
That said, analysts at several organizations have coalesced around standard methods for many common taxes. These methods are the backbone of the distributional analyses produced by organizations such as the U.S. Treasury Department, the Congressional Budget Office, the Joint Committee on Taxation, the Tax Policy Center, the Budget Lab at Yale, and the Tax Foundation.
At the state and local level, the incidence of a tax may also fall on households outside of the taxing jurisdiction. For example, a tax on corporate profits in D.C. will fall, in part, on shareholders who live throughout the world. This concept is called “tax exporting,” and it is important to consider. Several state and local taxes, especially business taxes, raise revenue for the District but do not place much of a burden on its residents.
How Progressive Is D.C.’s Tax System?
We have developed a methodology for measuring the distribution of the D.C. tax burden. In general, we follow standard approaches used by the U.S. Treasury Department, the Congressional Budget Office, the Tax Foundation, and the Tax Policy Center to distribute taxes to households. As is standard, we focus on the burden the D.C. tax code places on D.C. residents, which means we account for tax exporting.
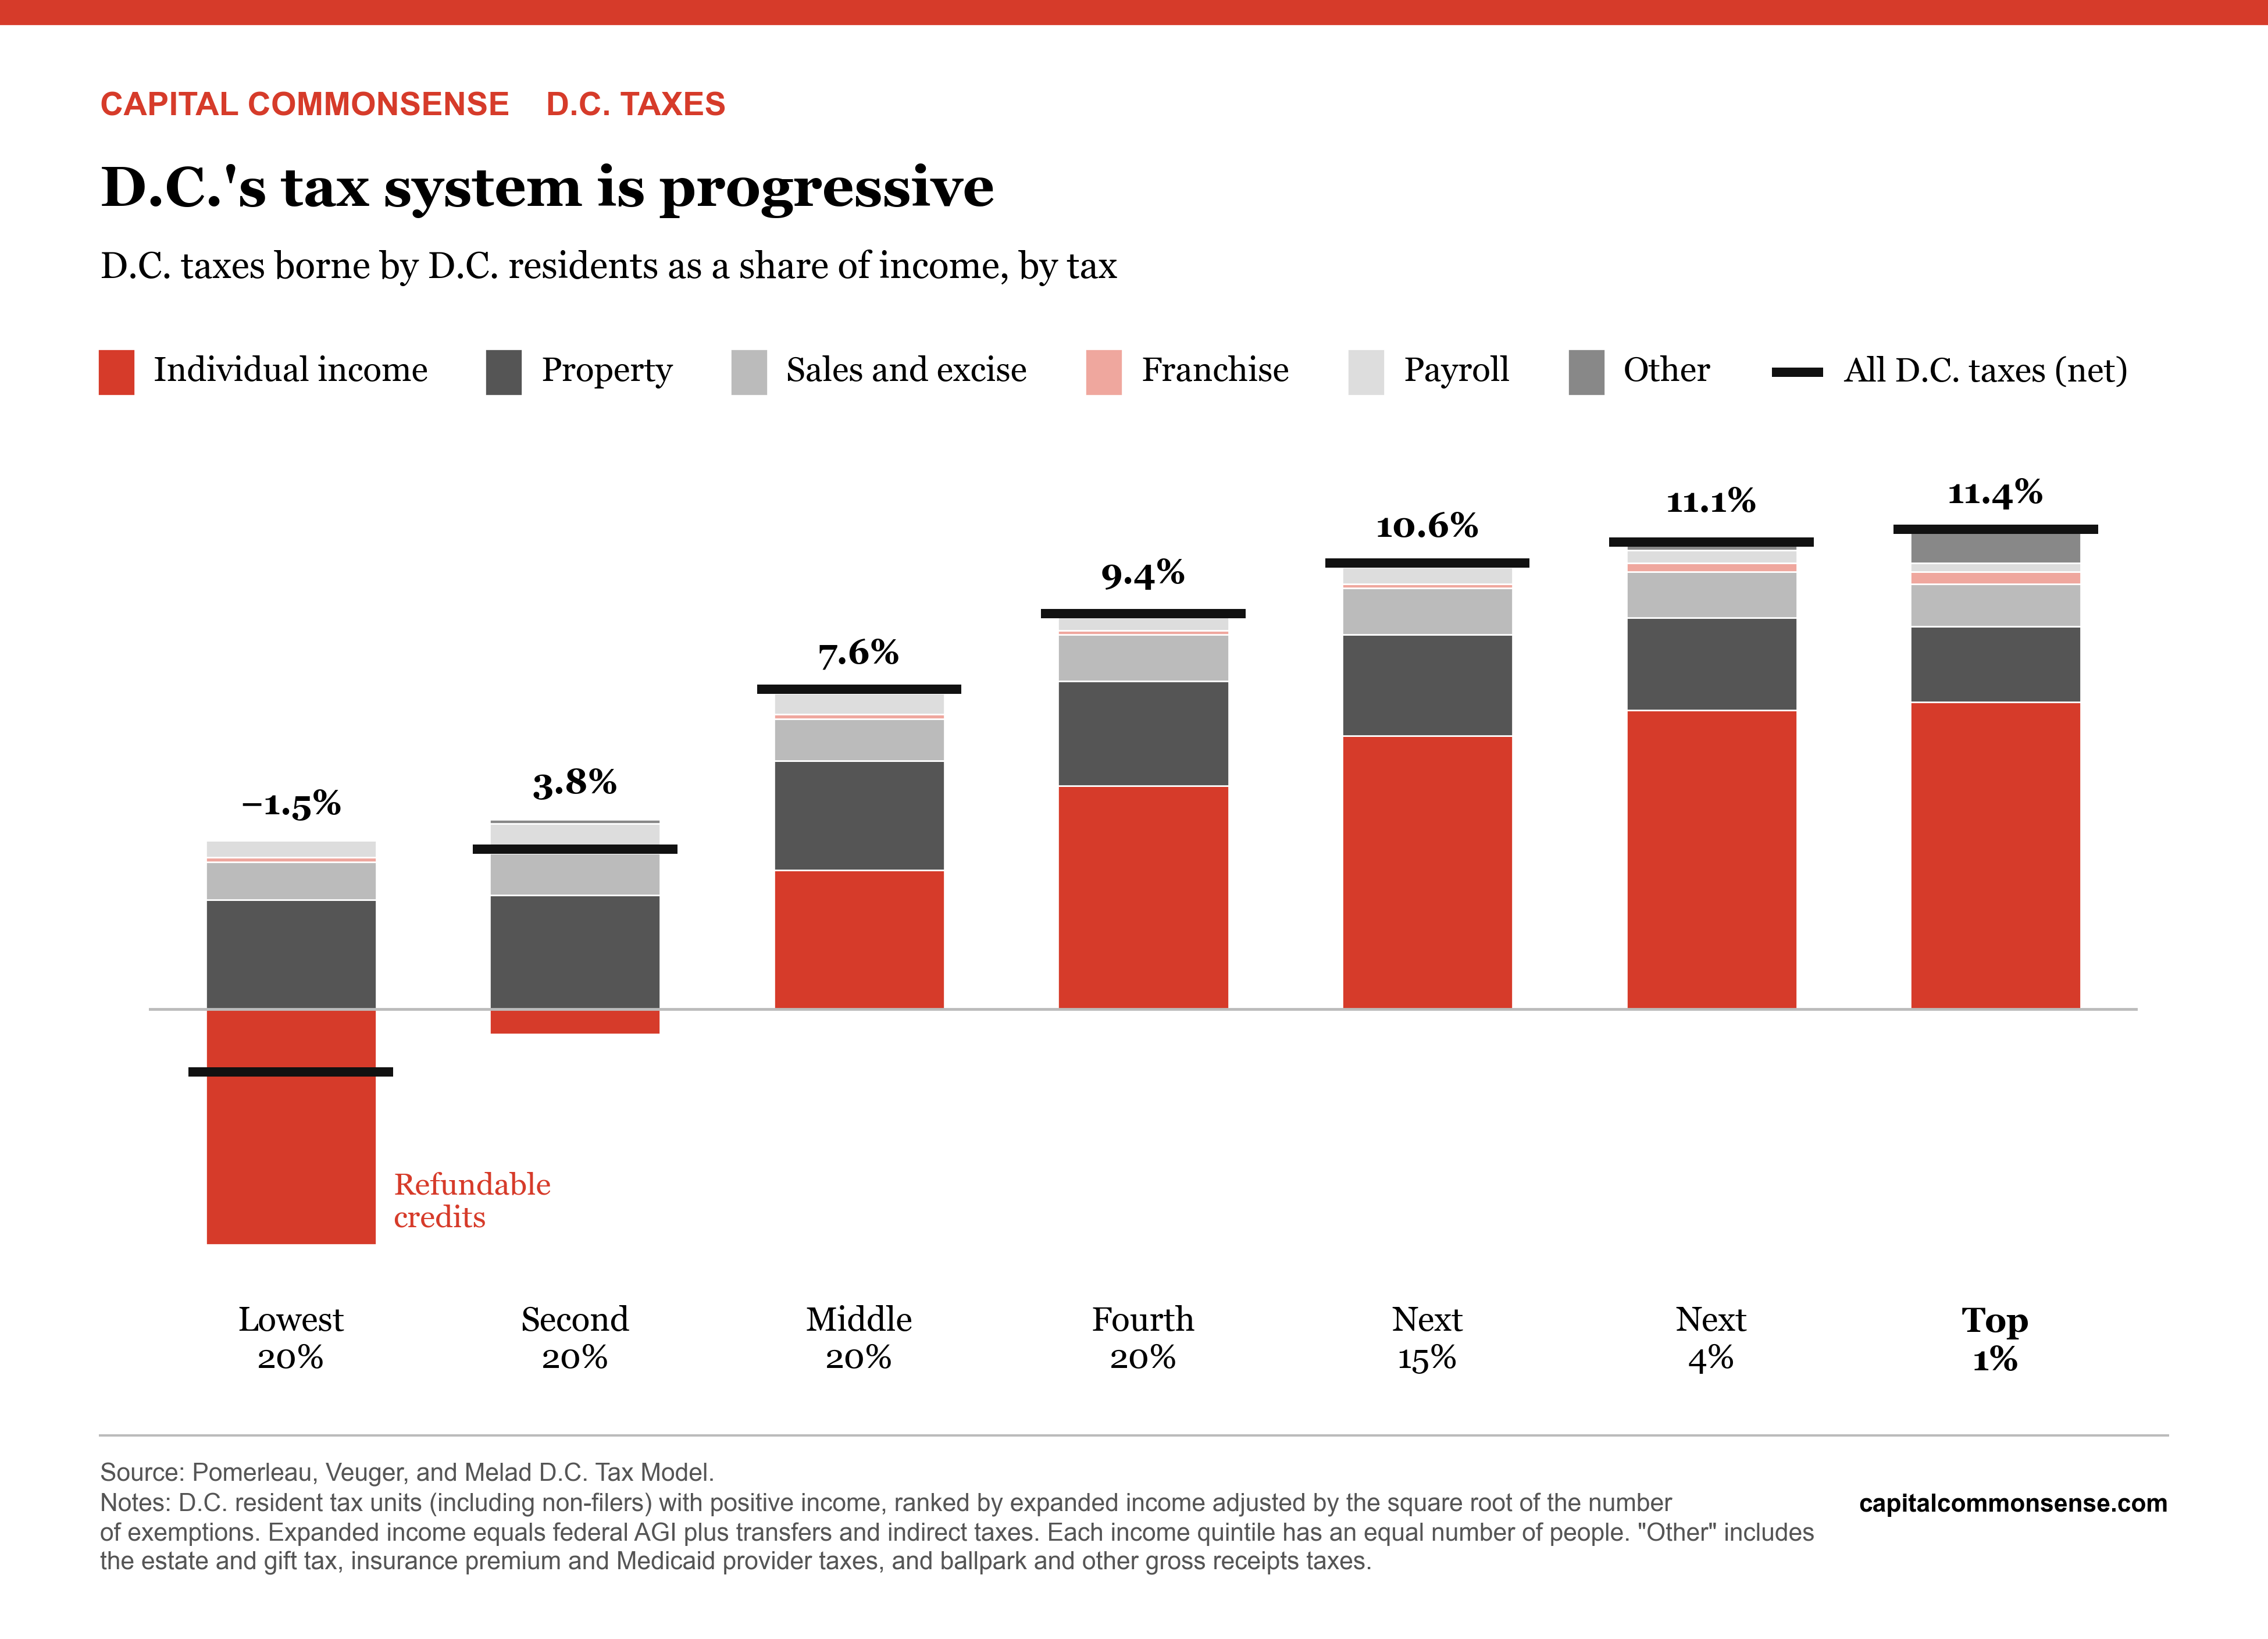
We find that D.C.’s tax system is progressive and that the tax burden rises with household income. The bottom 20 percent of D.C. residents, on average, receive a net refund from the District government equal to 1.5 percent of their income. The second 20 percent of tax units pay 3.8 percent of their income, and middle-income residents pay 7.6 percent. The effective tax rate ultimately rises to 11.4 percent for the top 1 percent of tax units.
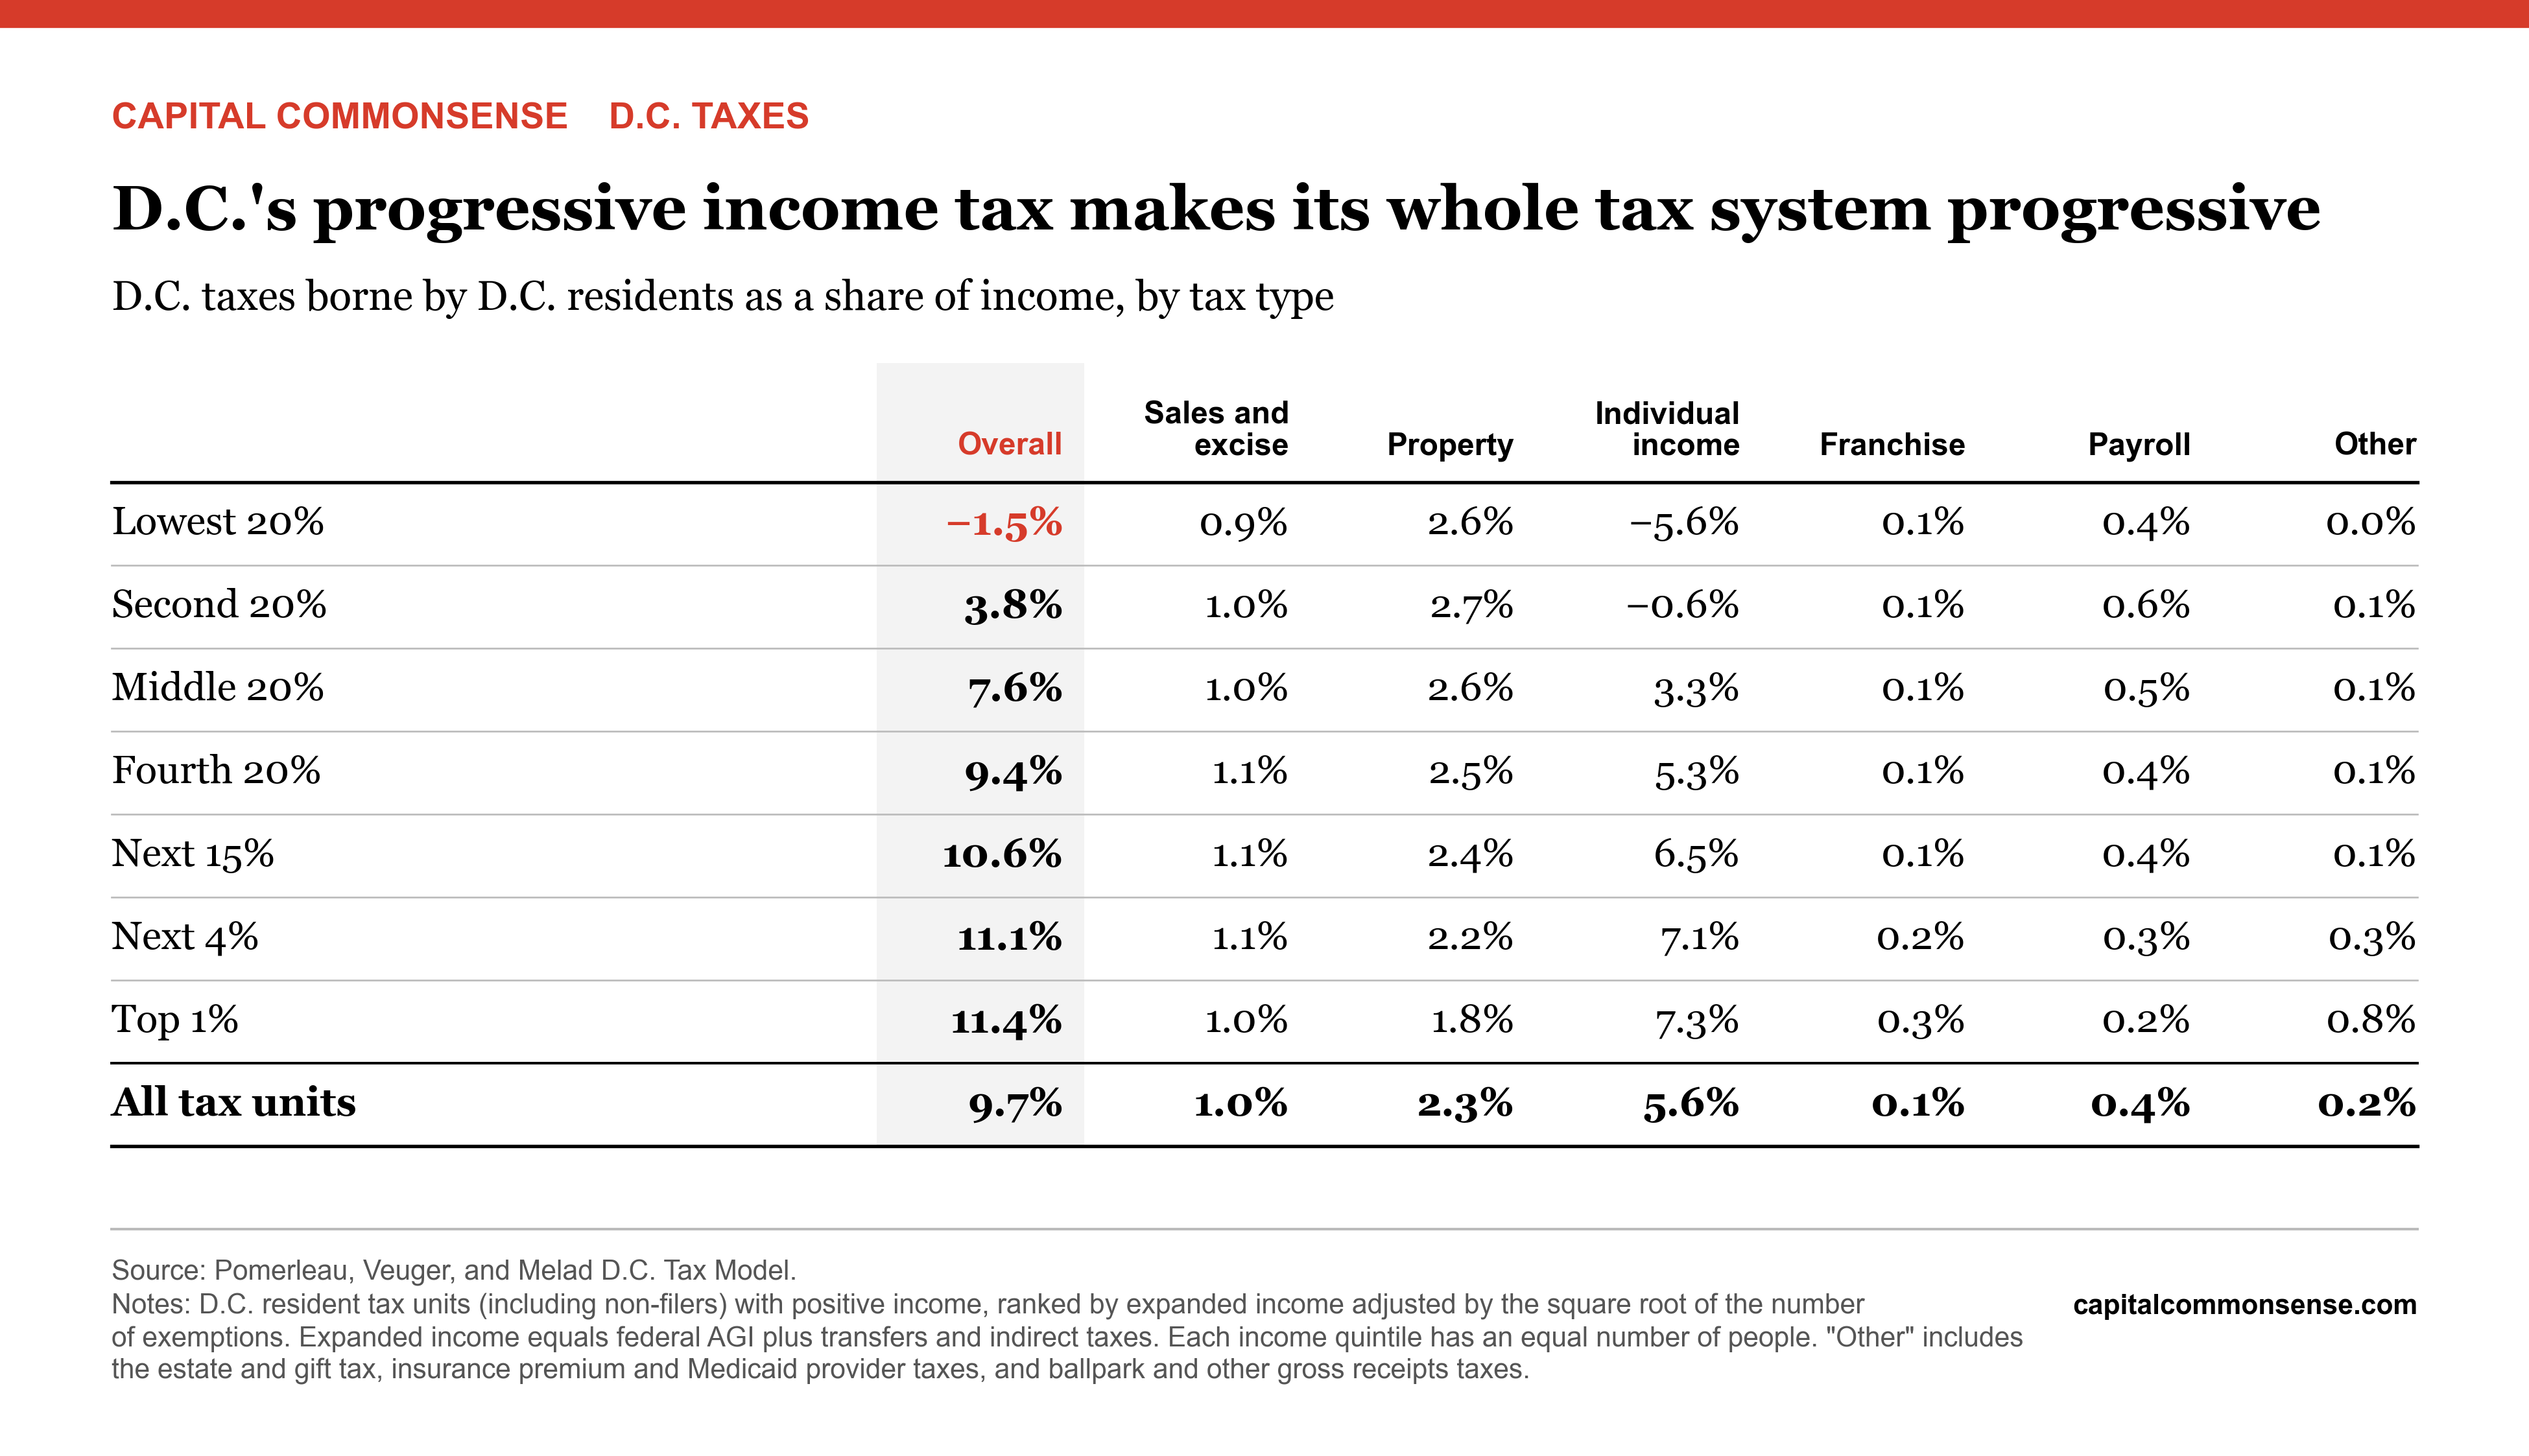
The progressivity of D.C.’s tax code is driven primarily by its highly progressive income tax. The income tax provides net refunds to the bottom 40 percent of tax units: a negative 5.6 percent effective tax rate for the bottom 20 percent and a negative 0.6 percent rate for the second 20 percent. This is due to refundable tax credits, such as the earned income tax credit. Meanwhile, the top 1 percent pays the highest effective income tax rate, 7.3 percent, driven by D.C.’s top individual income tax rate of 10.75 percent, one of the highest top marginal tax rates in the country.
Other taxes, such as sales, excise, property, and business income taxes, contribute less to the system’s progressivity. This is primarily because their distributions are flatter and because they place a lower overall burden on D.C. residents due to exporting.
We find that sales and excise taxes are slightly progressive through most of the income distribution. The bottom 20 percent of households pay 0.9 percent of income in sales and excise taxes, and the burden rises to 1.0 percent for the next two income groups and to 1.1 percent for upper-middle-income households. It falls slightly to 1.0 percent for the top 1 percent.
Sales and excise taxes are slightly progressive for two reasons. First, about 40 percent of sales tax collections come from taxing business-to-business purchases and fall to a significant extent on the owners of businesses. Second, low-income households devote a larger share of their expenditures to exempt goods and services, such as groceries and medicine.
Property taxes, which fall on both homeowners and renters, are modestly regressive overall. The property tax burden is between 2.6 percent and 2.7 percent for the first three income groups and falls as a share of income to 1.8 percent for the top 1 percent. This is because expenditures on housing (especially rent) make up a larger share of consumption for low- and middle-income households than for high-income households. The regressivity is only slightly offset by the homestead exemption, assessment caps, and discounts for seniors. The property tax on commercial property, on the other hand, is modestly progressive, but it is borne primarily by households outside of the District.
The remaining taxes, which include the corporate and unincorporated business franchise taxes, the paid leave and unemployment insurance payroll taxes, the estate tax, and various other gross receipts taxes, contribute little to D.C.’s tax burden on its residents. These taxes, combined, are progressive, but they contribute only 0.7 percentage points to D.C. residents’ overall tax burden.
Credit for Taxes Paid to Other States
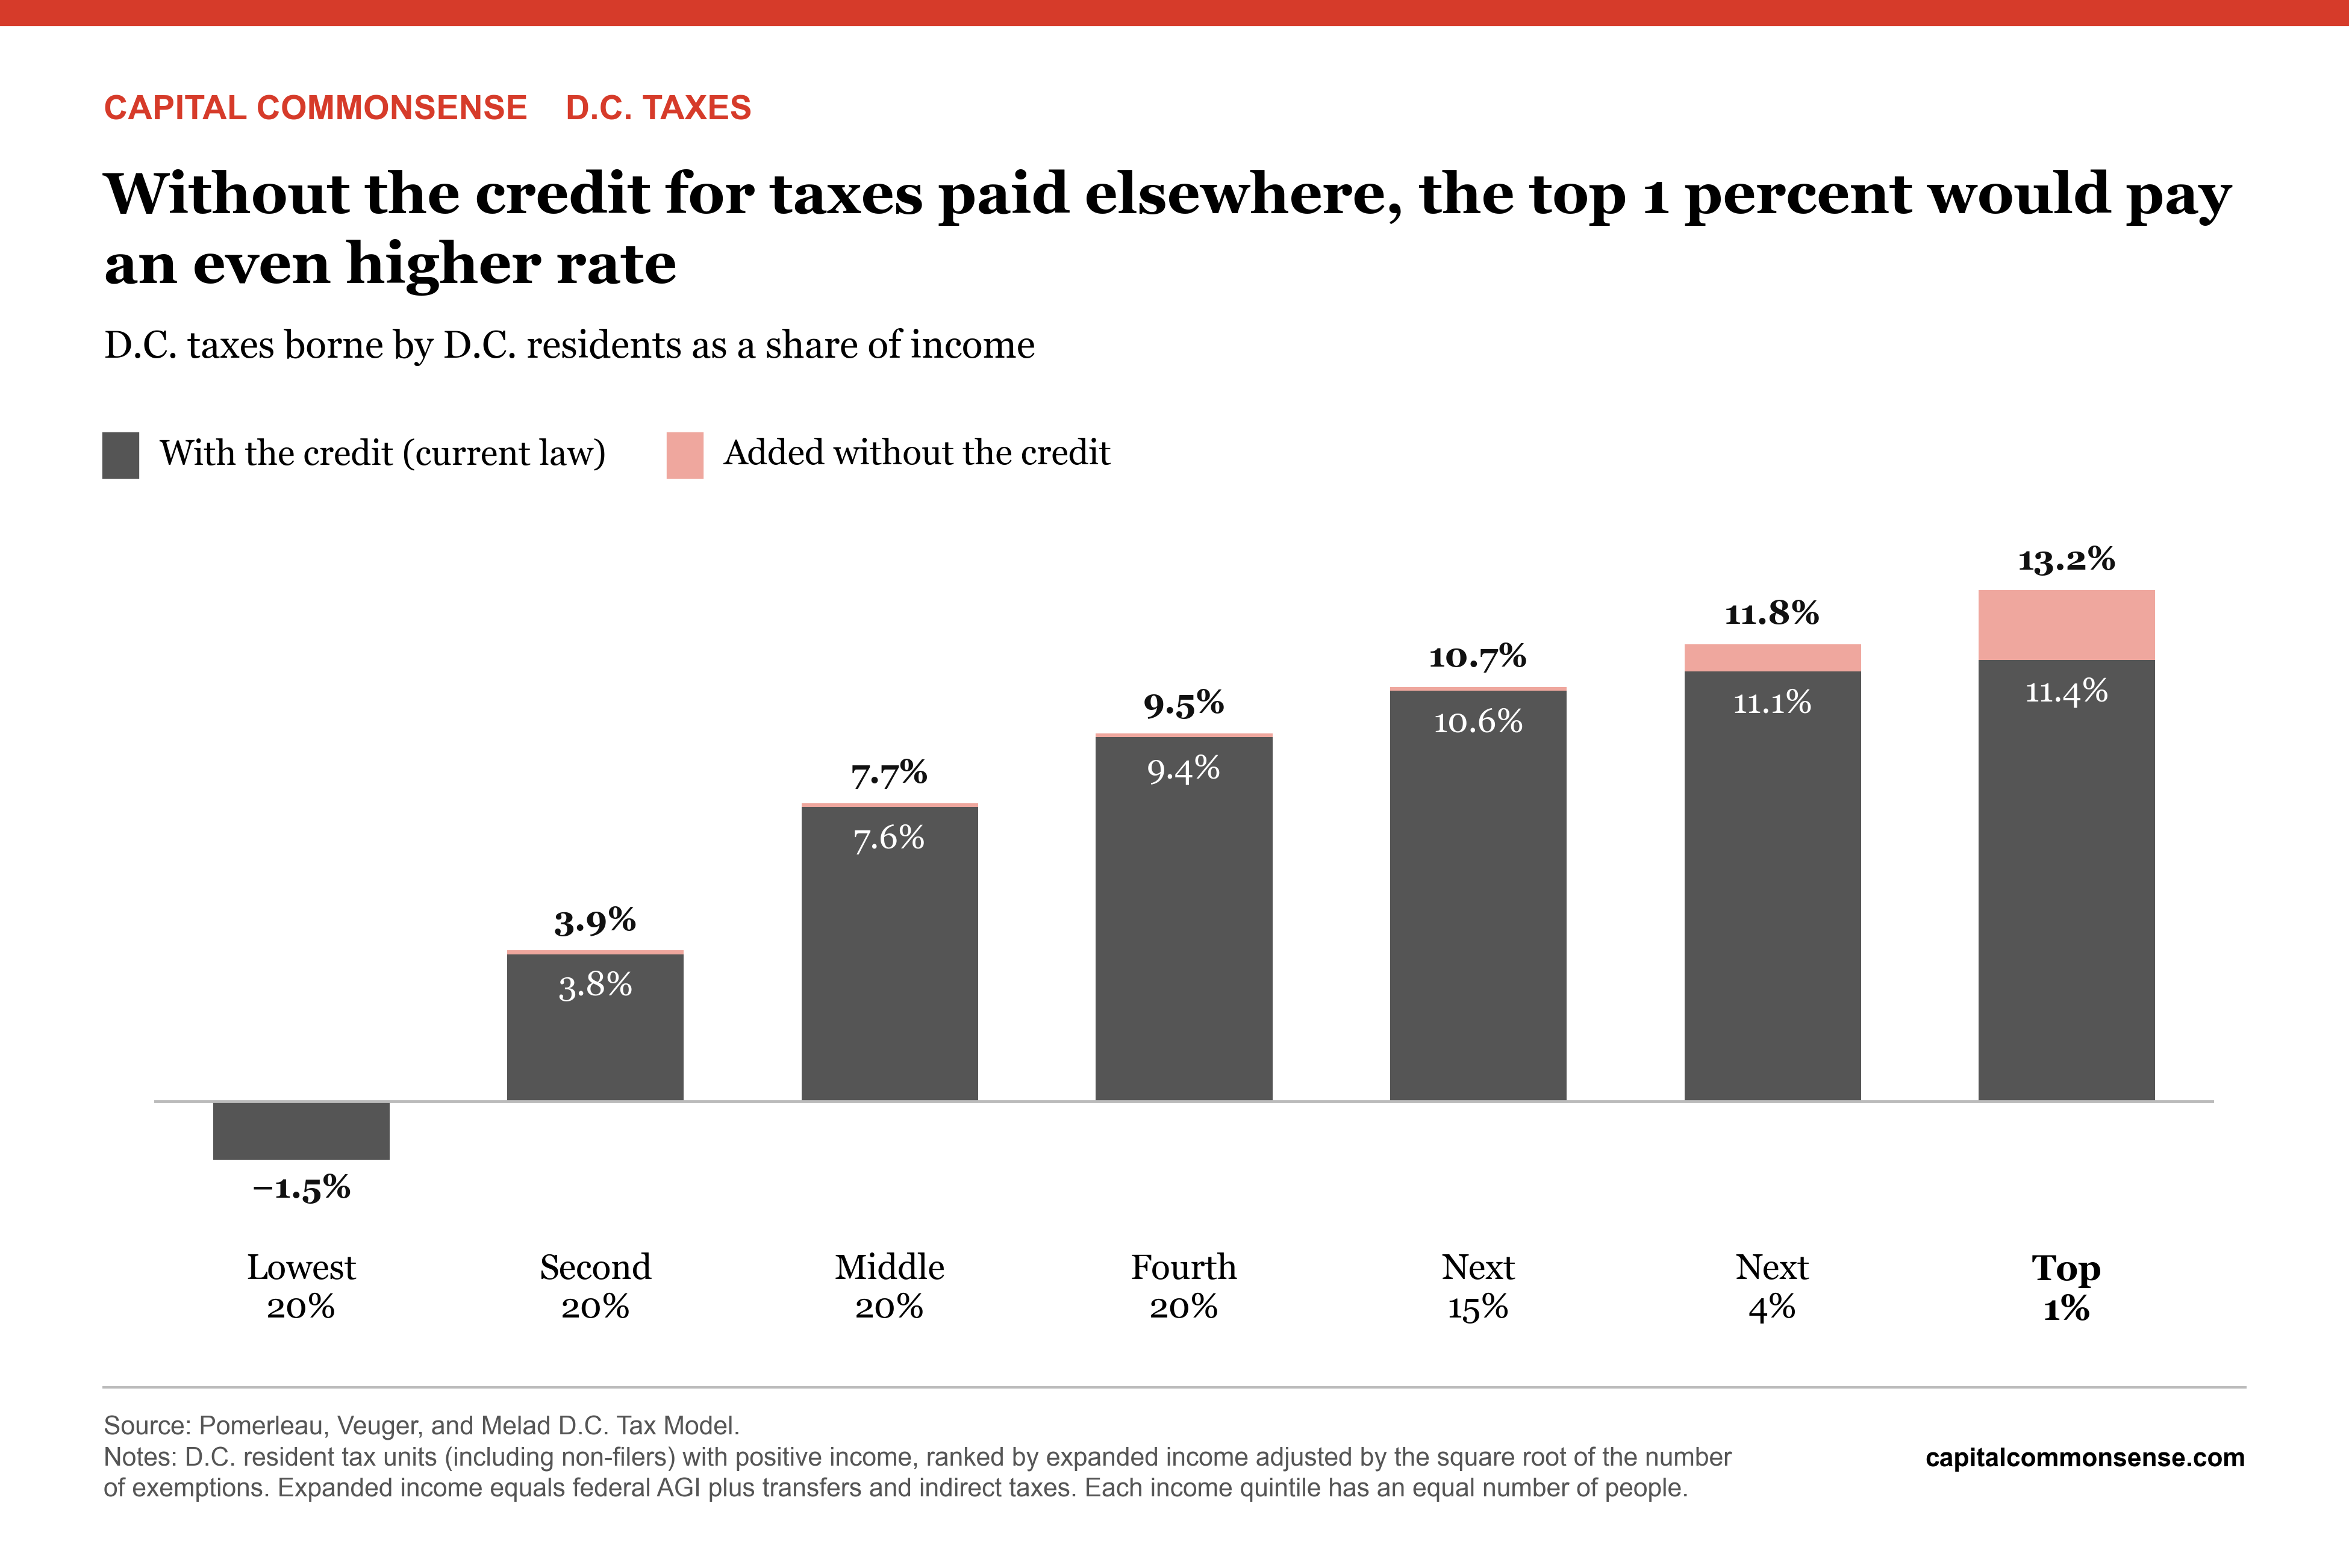
Our analysis finds that the distribution of the burden flattens out somewhat at the very top. The top 1 percent pays 11.4 percent of its income in taxes, which is only 0.3 percentage points more than the previous income group.
This is driven by a structural feature of state income taxes: a credit for taxes paid to other states. D.C. residents can earn income from both inside and outside D.C. Income earned in other jurisdictions may be subject to income tax in the jurisdiction in which it is earned. Since D.C. also taxes that income, the credit is meant to prevent “double taxation” when two jurisdictions tax the same income.
Perhaps unsurprisingly, very high-income households tend to earn income in multiple jurisdictions. As a result, they tend to use this credit more than other income groups. If we were to strip away the effect of this credit, D.C.’s tax system for D.C. residents would be more progressive. The effective tax rate on the top 1 percent would rise by 1.8 percentage points, leaving it 1.4 percentage points higher than the pre-credit burden on the previous income group of 11.8 percent.
Tourism, Commuters, and Exported Business Taxes
D.C. residents are not the only ones who pay taxes to the D.C. government. People come from around the world to visit D.C. and pay sales tax on their purchases in the District. Commuters from Virginia and Maryland who work and earn income in D.C. pay payroll tax on their earnings and sales tax on their lunches. Businesses that operate in D.C. pay various taxes, which are borne by out-of-state (and out-of-country) shareholders and workers.
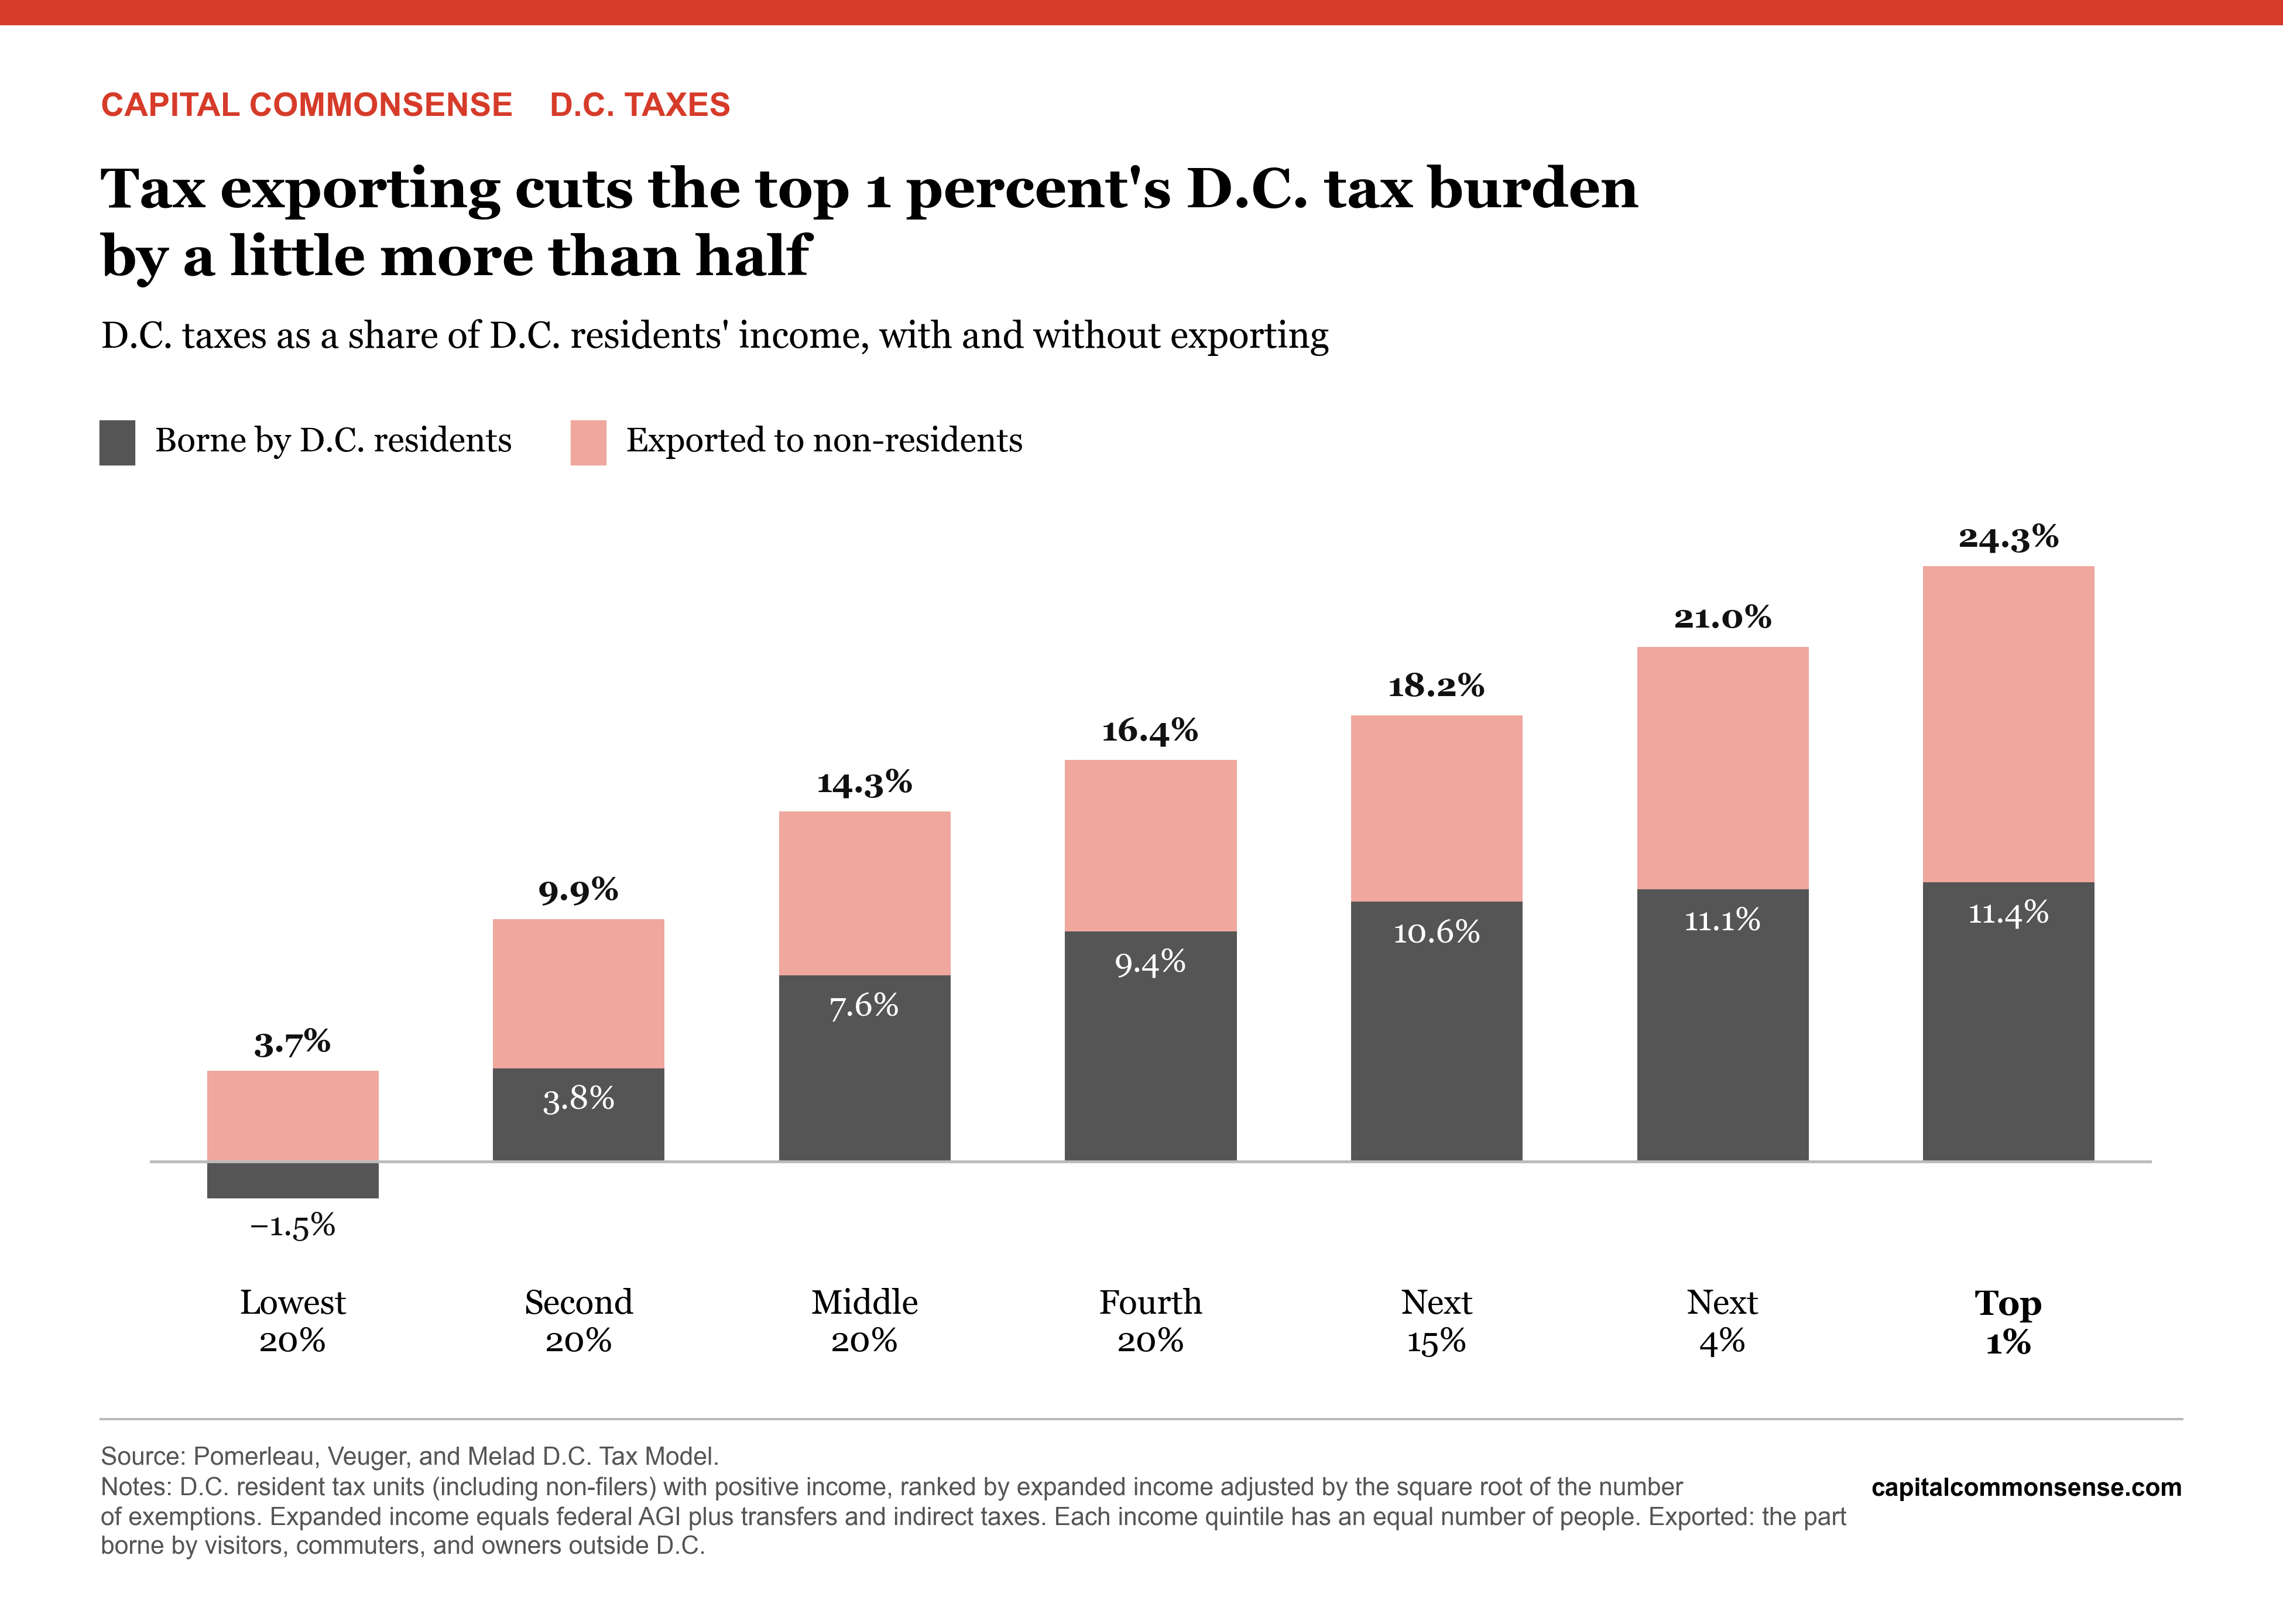
Although it is standard to account for tax exporting, it has a particularly large impact on the measured magnitude of D.C.’s tax burden. We estimate that 52.3 percent of D.C.’s tax burden is borne by non-residents.
Exporting affects the perceived progressivity of the tax code because some of the most progressive taxes are exported to a higher degree. For example, the corporate franchise tax is generally thought to be highly progressive because it falls primarily on owners of corporations, with some falling on workers and owners of passthrough business capital. However, owners of corporations generally live outside the District. Furthermore, to the extent that the corporate tax reduces the return to capital and labor in the District, it will shift that activity and the burden of the tax to the broader D.C. metro region. As a result, only 5.2 percent of the corporate franchise tax falls on D.C. residents.
If we did not account for tax exporting, D.C.’s tax system would look even more progressive. The chart below shows the distribution of D.C. tax incidence if we include the exported portion. Tax exporting reduces the burden on households at every income level, but the effect is largest for the top 1 percent, for whom it reduces the effective tax rate by 12.9 percentage points. This is because taxes like the sales tax, property tax, and franchise taxes fall heavily on this group but are exported to residents of other states.
Other income groups see reductions of between 5.2 and 9.9 percentage points. For low-income tax units, the most important exported taxes are the sales and excise taxes, of which a good deal is paid by tourists and commuters. Of the $1.2 billion that we estimate the District collects from the sales tax on non-business purchases, $616 million is paid by visitors and $200 million is paid by commuters.
Where We Differ From ITEP
ITEP’s claim that the top 5 percent of households pay a lower effective tax rate than most other income groups comes from its “Who Pays?” report. This report uses a microsimulation model of each state’s tax system to distribute the burden of state and local taxes to each state’s residents. ITEP’s method captures all major taxes that D.C. levies and accounts for tax exporting.
Its method produces much higher effective tax rates on low- and middle-income households than ours does. We effectively agree on how much the top income groups pay. We both find that the top 1 percent pays 11.4 percent. However, ITEP estimates that the second 20 percent faces an effective tax rate nearly three times higher than we do (10.6 percent vs. 3.8 percent) and that the middle-income group faces a burden 1.5 times higher (11.5 percent vs. 7.6 percent).
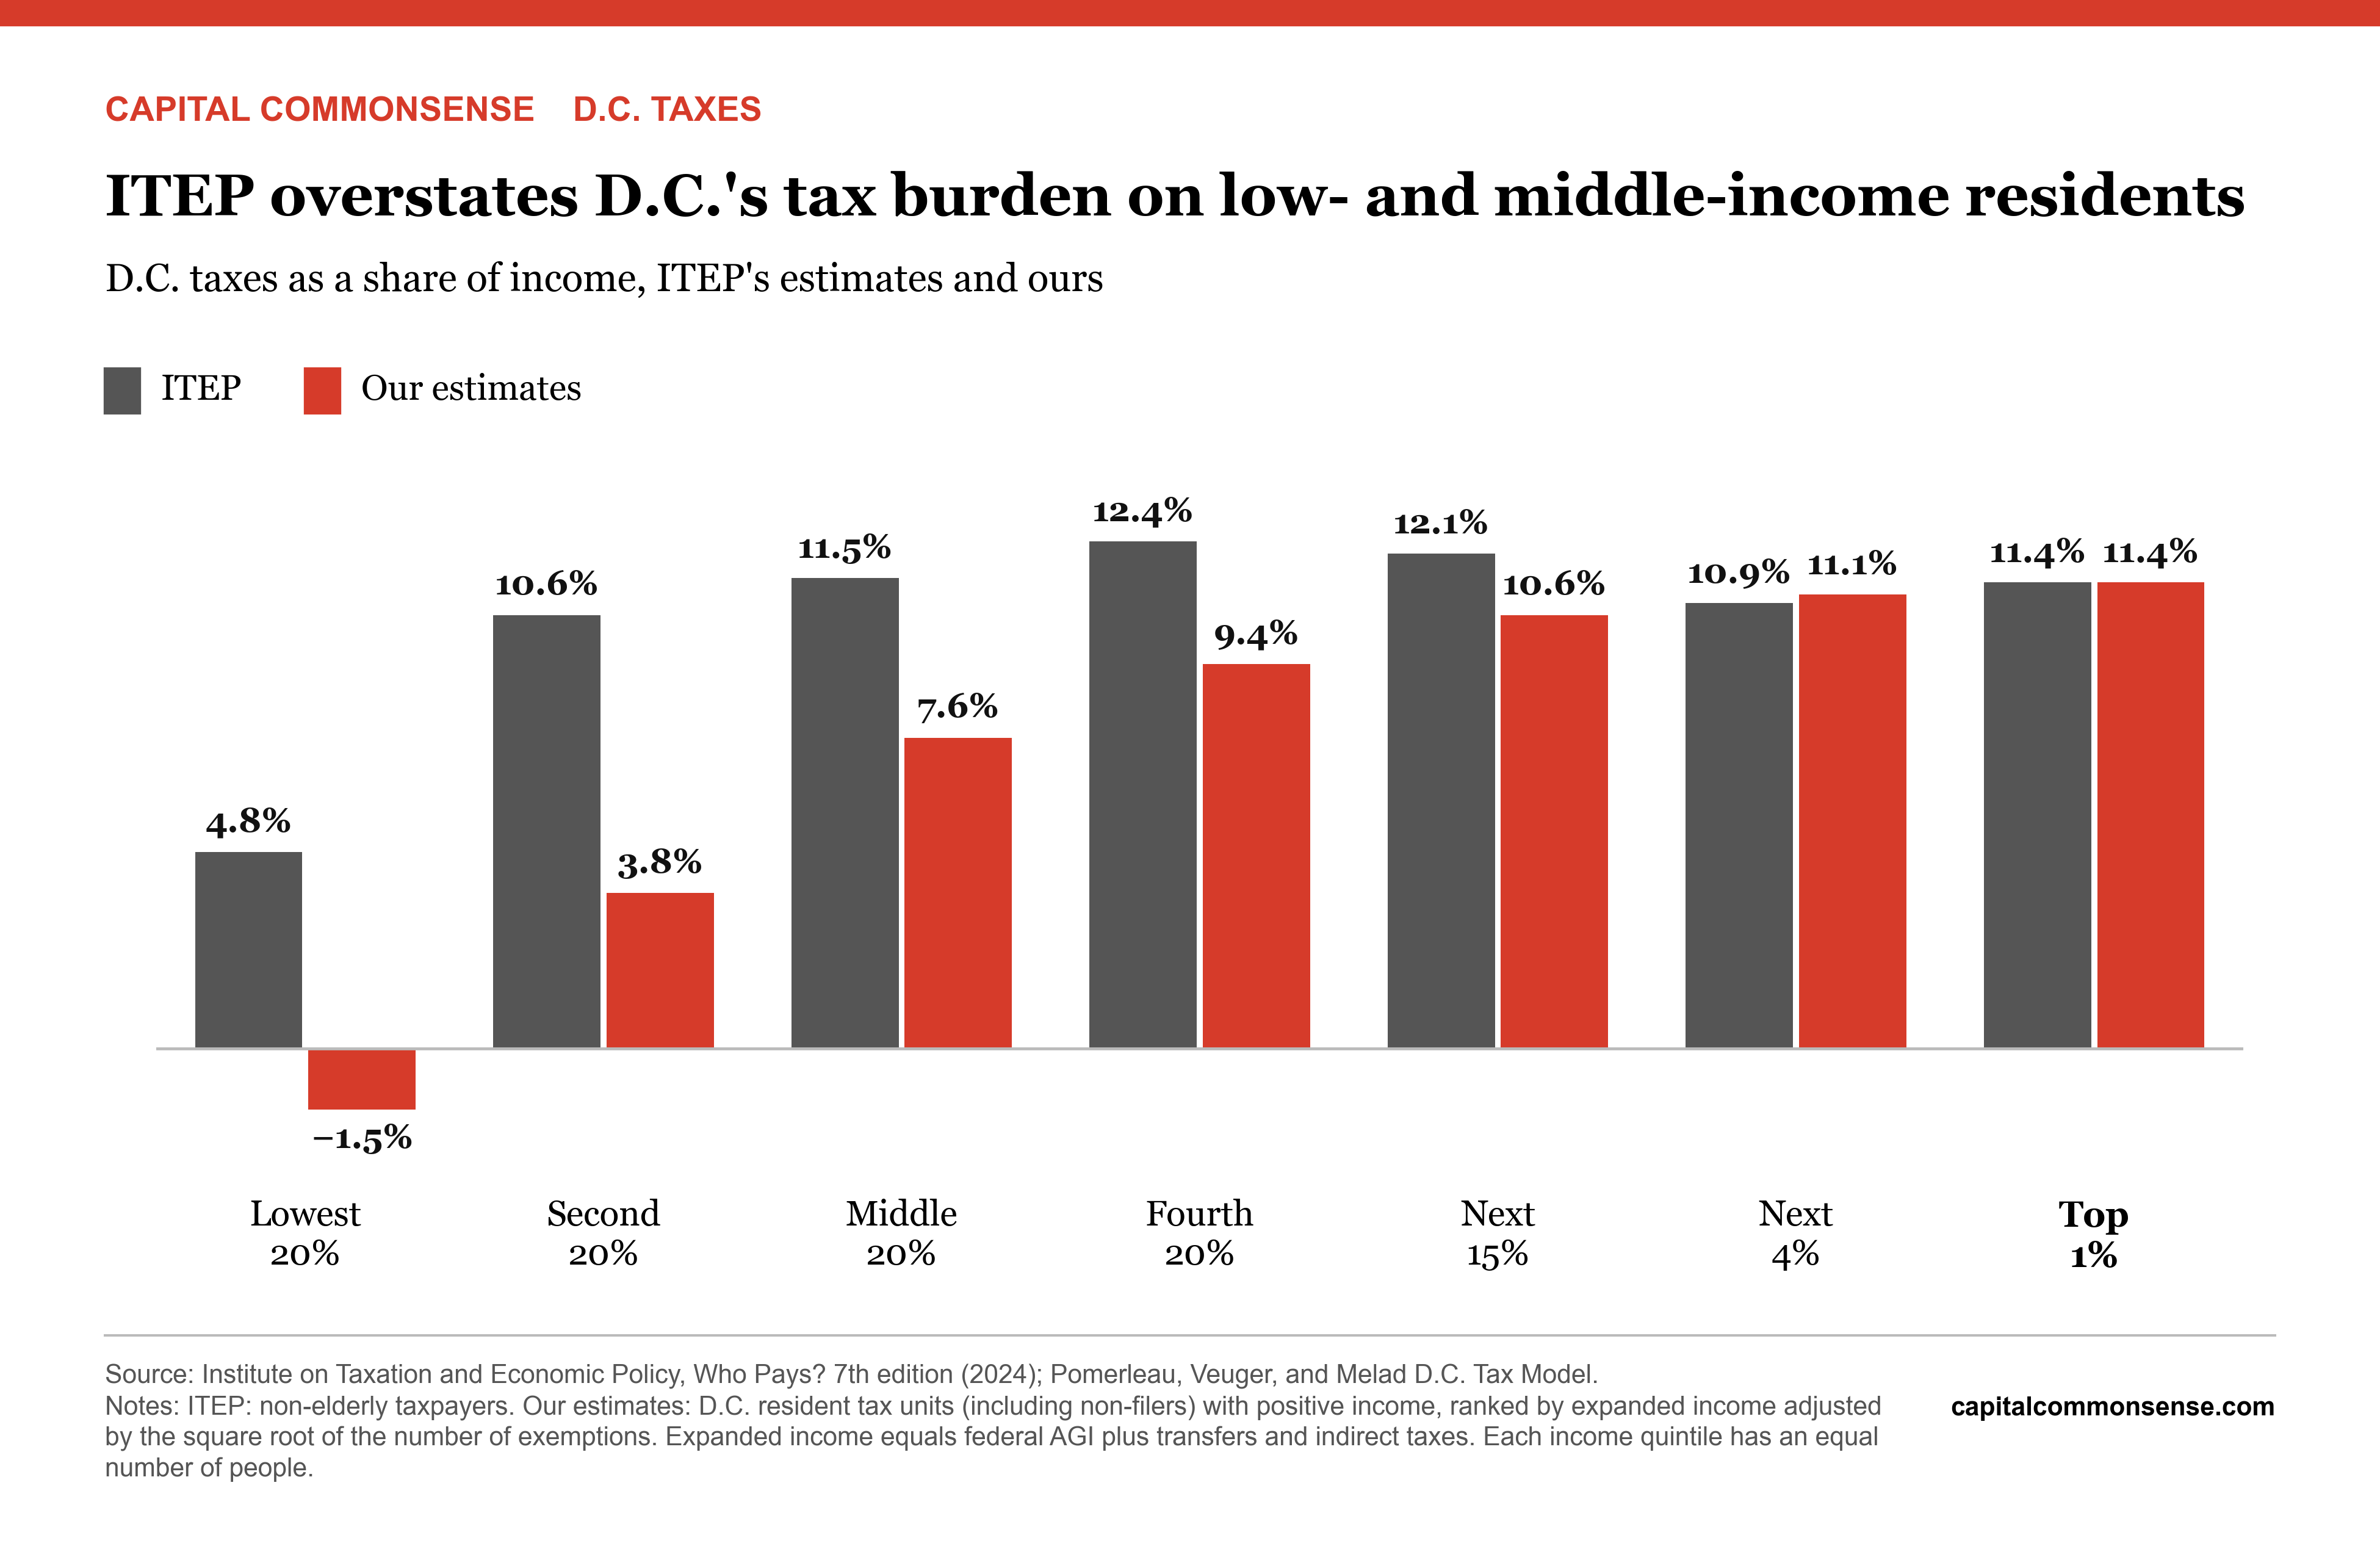
ITEP’s methodology is not entirely transparent, so we do not know the full extent to which our approaches differ, but one of the driving forces behind ITEP’s striking results is its method for distributing sales and excise taxes. In short, its method distributes the burden of sales and excise taxes (and other taxes it says fall on “consumers”) to households based on reported household spending. This contrasts with how it handles other taxes, which are distributed to households based on reported income.
This methodological choice matters a great deal. While we estimate an effective sales and excise tax rate of 0.9 percent for the bottom 20 percent, ITEP finds a rate that is six (!) times higher, at 5.5 percent.
There are two problems with the ITEP approach.
First, the method has conceptual problems. It is highly sensitive to the timing of household income and spending. Under this method, a household that earns income today and saves it faces no sales tax burden. Conversely, a household that spends down its savings faces a tax burden but may have little to no reported income. This treatment is inappropriate because it ignores the future taxes that a household expects to pay on its savings and the past income that funds today’s spending.1
Second, the method has practical problems. The data that it uses, from the Consumer Expenditure Survey (CEX), mismeasures levels of consumption and income. Most notably, low-income households tend to underreport income. This results in implausibly high consumption-to-income ratios for low-income households.
As a result, ITEP’s method creates extreme effective sales tax rates for some households. It tries to address this by excluding seniors, who tend to spend out of wealth, but this is arbitrary and does not fix the fundamental conceptual issues with this approach.2 It also makes it very difficult to model D.C. policies such as senior property tax relief and the estate tax.
This methodological choice also has implications for other taxes because ITEP distributes several taxes on businesses to “consumers” based on household spending. For example, it seems to assume that a portion of sales taxes that apply to business-to-business purchases falls on “consumers,” which also overstates the regressivity of this tax.
Conclusion
If the Council’s goal is to have a progressive tax system, that mission is already accomplished. D.C.’s current tax code is quite progressive. In fact, ITEP itself ranks it as the most progressive in the nation. In addition, a good portion of the tax burden is shifted to non-residents.
Some highly progressive tax increases can come with steep economic tradeoffs. Raising the tax burden on high earners and businesses would make it less attractive for these taxpayers to locate in the District. Tax increases on businesses would be especially unwise while D.C. is in the midst of an economic downturn due to federal policy.
Instead of focusing on making an already progressive system more so, the Council should focus on reforming the tax system to make it more efficient. Some of these reforms could themselves raise revenue. For example, D.C. could raise meaningful revenue by broadening the sales tax base to include more goods and services. Given D.C.’s unique circumstances—its relatively small size at the heart of a large metro area and its limited tax autonomy—the Council should give particular consideration to the incidence of any revenue raisers on residents versus non-residents.
Our method avoids this issue by distributing sales and excise taxes to households based on reported income. We adopt the standard approach followed by the U.S. Treasury Department, the Congressional Budget Office, the Tax Foundation, and the Tax Policy Center. This approach distributes the burden of these taxes to households in proportion to their share of labor compensation, above-normal returns to capital (returns in excess of the routine return to saving), and transfer payments. It then uses consumption data to reallocate the burden between households to account for the differential taxation of goods and services. When calculating above-normal returns, we assume that 50 percent of corporate capital income and 70 percent of passthrough business income represent above-normal returns. In line with the Tax Policy Center’s approach, we assume that government transfers, in the long run, are indexed to real wages and fall under a sales tax. To see why the sum of this income is equal to the sales tax base, start with a household’s budget constraint: Spending + Saving = Labor Income + Capital Income + Government Benefits – Tax. Households earn income from labor, capital, and government benefits, but have to pay tax. They can either spend or save the income. Rearranging this gives us the sales tax base: spending is equal to total income minus saving: Spending = Labor Income + Capital Income – Saving + Government Benefits – Tax. We adopt the same approach to distribute the portion of the residential property tax that falls on homeowners and renters.
Our approach does not require this. Unlike ITEP, we include all residents with positive income.
A tax system is progressive only if it promotes progress, and taxing labor, buildings, and investment does the opposite. Only a land value tax earns the name.