

In my previous post, I explained how the federal government contributes to funding DC’s local government. Today I will compare the amount of funding DC receives to the situation in the fifty states. While the headline numbers suggest that DC’s funding is particularly generous, that impression is driven by special features of DC’s governance structure. What looks like excess funding is in reality compensation for constraints imposed on the District. A true like-for-like comparison, to the extent that such a thing is possible, places DC in the middle of the pack.
The standard source for budgetary comparisons between the states is the Census Bureau’s Annual Survey of State and Local Government Finances (ASLGF). It includes consolidated state and local numbers, which is essential for any comparison involving DC. For fiscal year 2024, the most recent year available, the survey puts federal aid at $8.1 billion, or 38% of the District’s general revenue.1 That headline number is higher than any state’s consolidated share: it exceeds Alaska’s and Kentucky’s by more than a percentage point. The national average sits just below 25%.
To get from the headline number to a like-for-like comparison involves first making two straightforward adjustments to the ASLGF numbers, and then thinking about a counterfactual world in which DC loses its criminal justice subsidy and higher Medicaid matching rate, but gains the ability to tax income and property the way any of the states can.
The first wrinkle is that the ASLGF allocates all of the federal funding received by WMATA to the District’s consolidated revenue. But WMATA is a regional compact involving Maryland and Virginia in addition to the District. If we use WMATA’s subsidy formula to attribute the federal funding to the three jurisdictions, DC’s share drops from roughly $1 billion to about $370 million. This moves DC’s federal share down to 36.2% and to third place, now behind Alaska and Kentucky.
The second wrinkle runs in the opposite direction. Congress shifted much of the criminal justice system onto the federal budget in the 1997 Revitalization Act. Funding for those functions is therefore not included in the ASLGF. The states are themselves responsible for funding these activities, and I include the funds in the District’s consolidated revenue to move closer to a clean comparison. The funds involved are significant (some $780 million in FY 20242) and move DC back to first place at 38.5%.3
Now let’s think about the counterfactual in which DC is treated like all other states. This would affect both federal funding and own-source revenue.
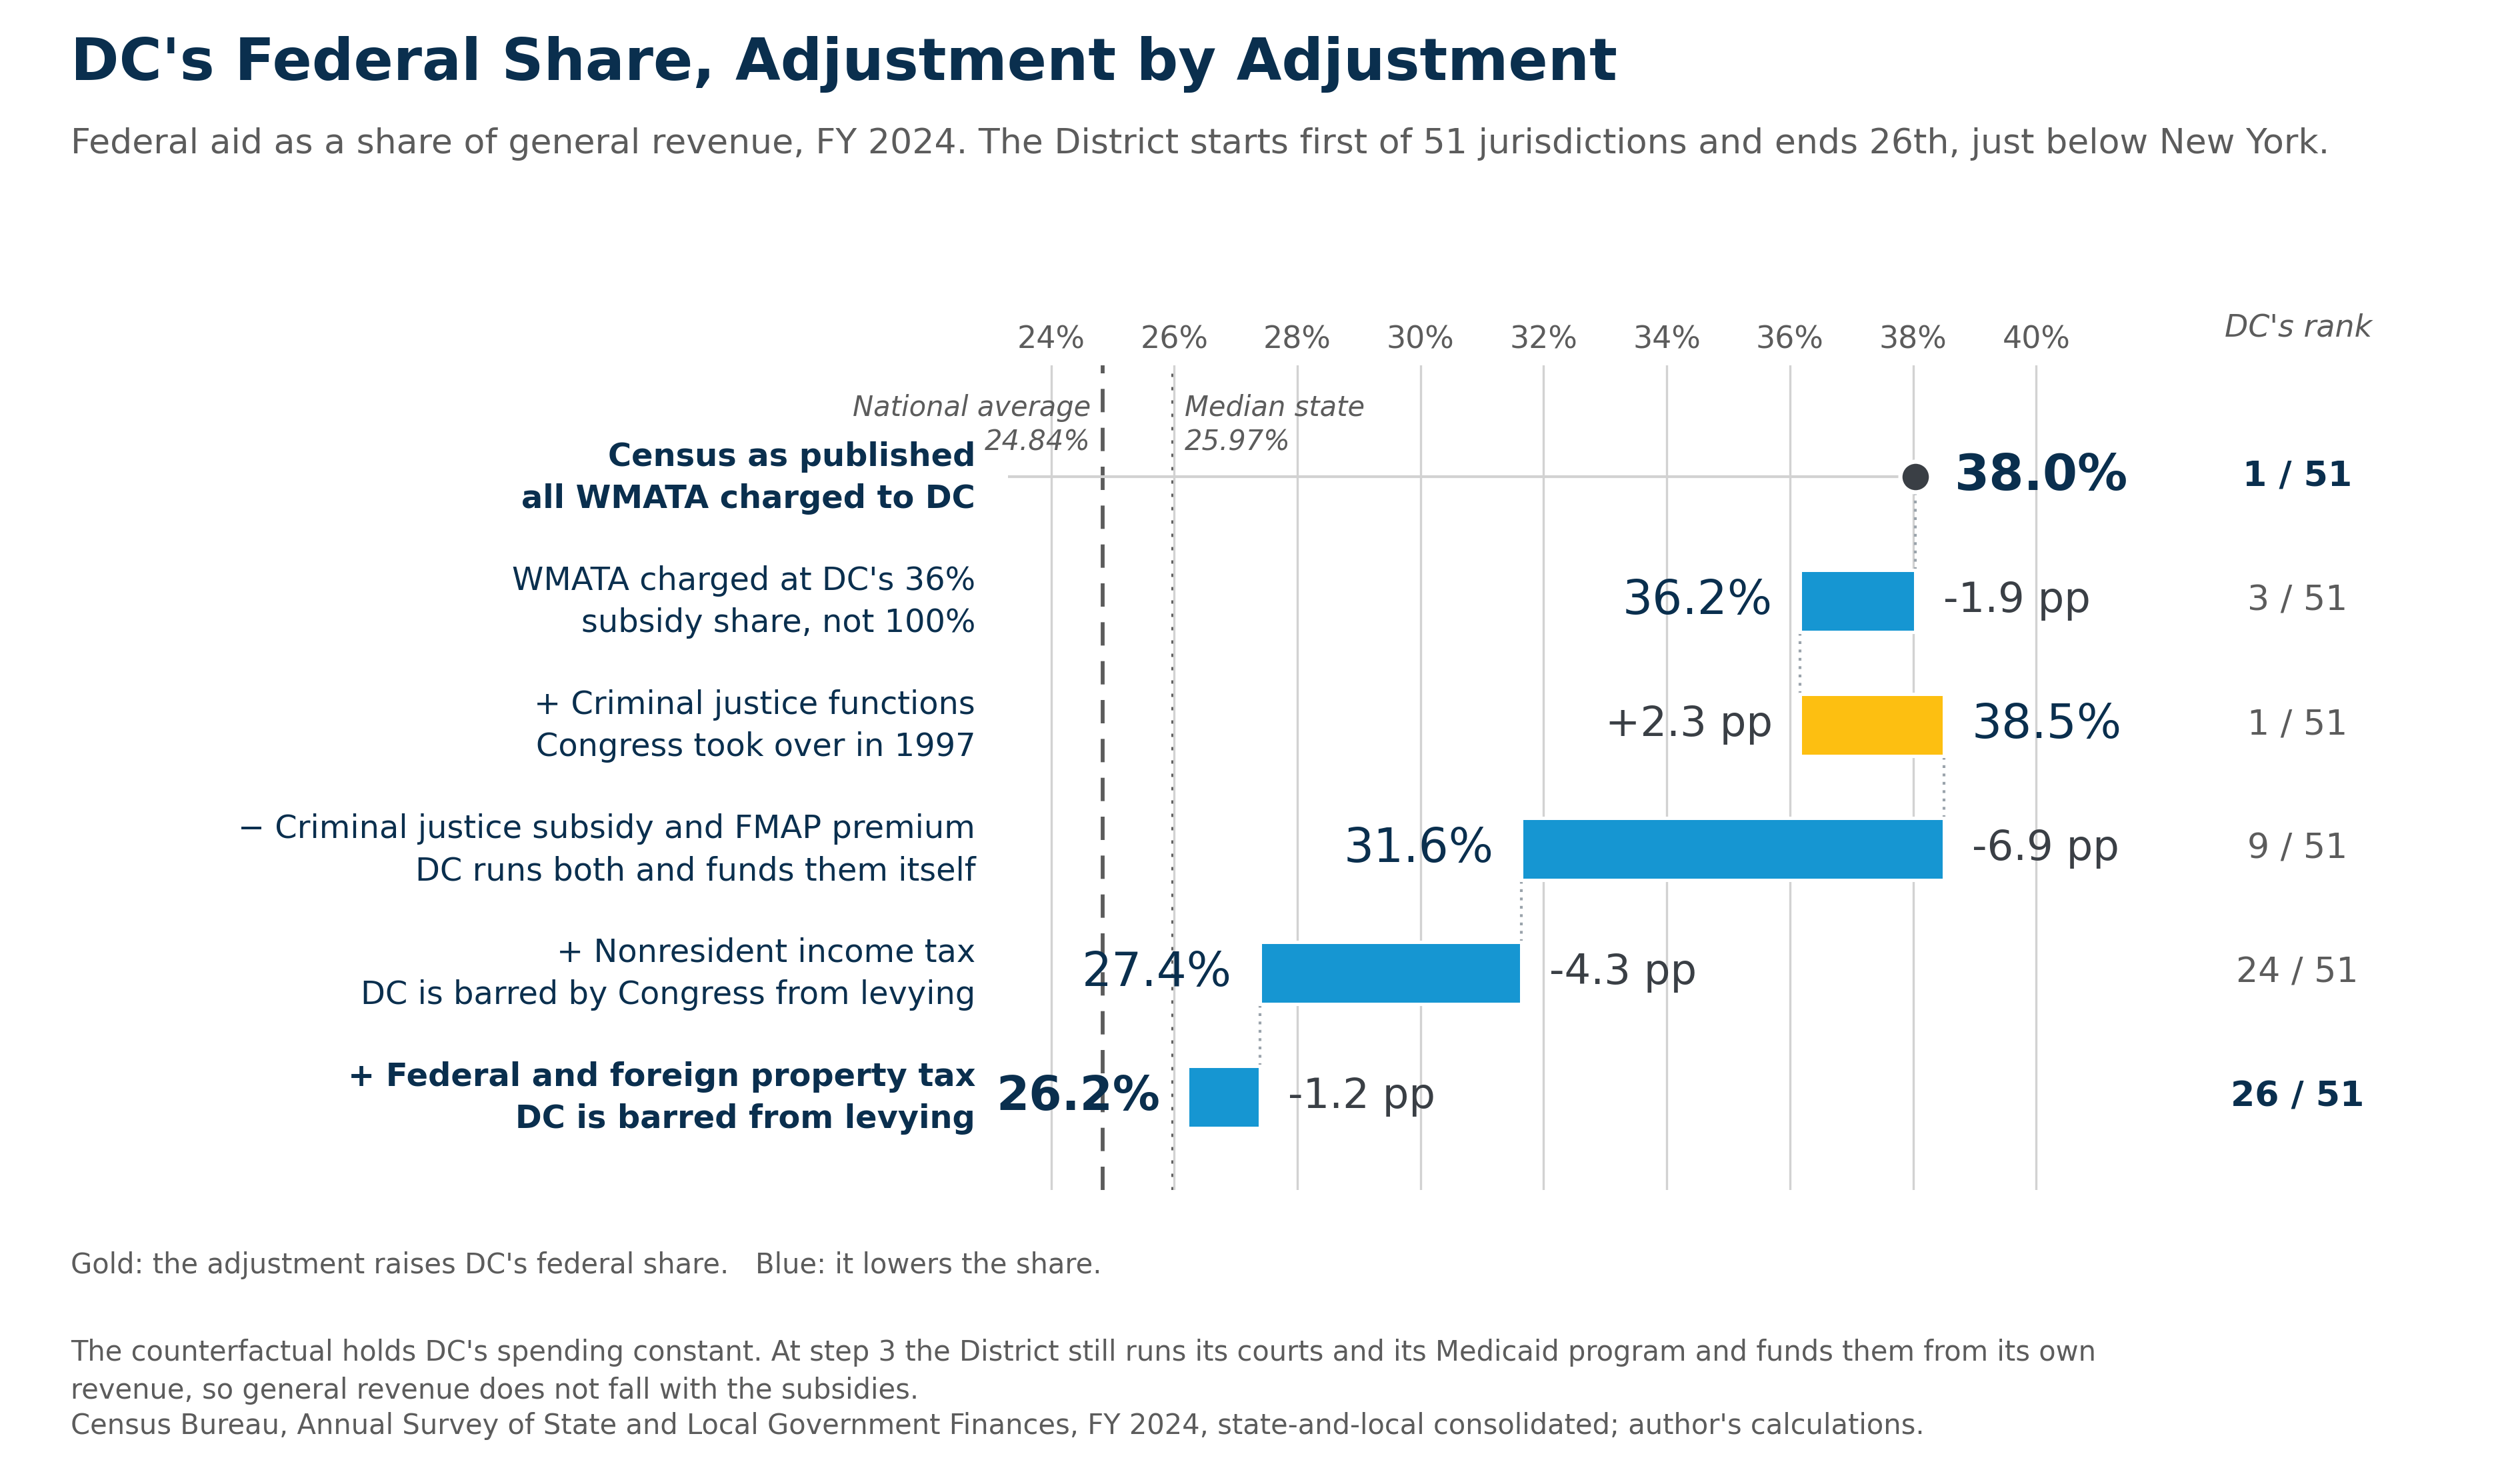
First, federal funding. DC would have to pay for its own criminal justice system: the $780 million we just added in comes back out. And DC’s Medicaid program would be treated like that of any state. DC would lose its special Medicaid matching rate or Federal Medical Assistance Percentage (FMAP). As I will discuss in more detail in the next post, the federal government picks up 70 percent of the bill for DC’s “regular” Medicaid spending.4 If DC were a state, that rate would be 50 percent, costing DC about $680 million. Removing both of these federal subsidies would lower DC’s federal revenue share to 31.6 percent, ninth place, between Mississippi and Oklahoma.
Second, own-source revenue. There are two major sources of revenue that the states can rely on and DC cannot. The first is taxes levied on the incomes of people who work in DC but live elsewhere. As the urban heart of a major metropolitan area, DC would be able to dramatically increase its income tax revenue if it were allowed to tax these workers. Based on the American Community Survey Public Use Microdata Sample, nonresident DC-source wages in 2024 amounted to almost exactly $50 billion. The forty or so states that tax wages all tax such income at their ordinary income tax rates, and the workers receives a tax credit from their home states. If we apply DC income tax rates to these wages, revenue comes to about $3.2 billion.
That estimate requires two adjustments that run in opposite directions. Some DC residents commute out to Maryland and Virginia, and in our counterfactual DC would have to credit them for taxes paid there, which costs about $400 million. But the ACS also underestimates wages: it puts total wages earned in DC at $84 billion against $97 billion in the BEA’s place-of-work series, and scaling by that ratio raises the nonresident base to about $58 billion.5 A reasonable estimate that accounts for both changes is that DC would be able to net some $3.3 billion in additional income tax. This would lower the federal share of DC’s general revenue to about 27.4%. DC falls to twenty-fourth place, just above North Carolina.
The second is the property tax. Much more of DC’s real property is owned by the federal government and foreign governments than is the case for the states, dramatically reducing its ability to collect property tax revenue. DC collected $2.95 billion in real property tax in FY 2024 and exempted $2.20 billion. Federal property alone accounted for $1.22 billion of the exempt total, with embassies and international organizations costing DC another $140 million. Of course no state can tax federal property either. But while federal property constitutes 23.7% of the potential property tax base in DC, that number is almost certainly in the low single digits for other states. If we count only the federal excess over 5 percent of the total potential property tax base, along with the embassies and international organizations, DC’s forgone property tax revenue still comes to $1.1 billion. Adding it to own-source revenue brings the federal share to 26.2 percent and takes DC to twenty-sixth place, just below New York.
Now, there are elements of this exercise that some may quibble with—it holds wages, rents, employment, and other jurisdictions’ tax rates fixed, for example—but the overall picture is clear. DC’s federal revenue share looks larger than it really is because DC does not have access to the tax instruments other states use. Its total revenue (federal plus own-source) would be greater if it lost its subsidies but gained tax autonomy. To add insult to injury, much of the funding it receives in lieu of tax autonomy comes with serious strings attached. That much of this funding is routed through the Medicaid program is an example of that, and the one that I will focus on in my next post.
Careful readers will notice that this exceeds the roughly $6.5 billion that flowed through DC’s books in fiscal year 2024. As discussed in my previous post, the District’s Annual Comprehensive Financial Report does not include independent authorities and interstate compacts like the DC Housing Authority, DC Water, and WMATA. It also separates out the University of the District of Columbia’s finances. The ASLGF draws different lines that I accept here for the sake of cross-state comparability.
I estimate funding for the incarceration of DC Code felons by the Bureau of Prisons at $150 million based on average cost. Local prosecution by the U.S. Attorney's Superior Court Division is not separately appropriated and not included here.
There are some other DC-specific federal payments we could include here, such as the DC Tuition Assistance Grant, but they do not meaningfully move the numbers.
By this I mean spending on those Medicaid beneficiaries who are not part of the Affordable Care Act’s expansion population, for which spending is matched at 90% in every state. 20 percent of the remainder ($3.4 billion) equals $682 million.
An alternative approach is to build the base from the BEA’s adjustment for residence, which implies roughly $63 billion in nonresident DC-source wages. I use the ACS instead. The BEA measure follows the employer’s location, so it counts a Virginia resident working from home for a DC employer as earning DC-source wages. The ACS, which asks where people actually work, produces a more conservative (and more correct) estimate.
