

Tax increases are likely coming to the District this year or next. Council Chair Phil Mendelson punted on major tax increases in this year’s budget—balancing the budget with a mix of one-time funding and reserves—but the Council is holding hearings on revenue this fall and the Chair has said to expect them.
We will discuss the pros and cons of potential revenue measures and what they would fund in subsequent posts, but I want to begin by looking at tax collections and policy over the past decade to better orient the conversation. (Last week’s post on where the District gets its money is here.)
Councilmembers and our next mayor, Councilmember Janeese Lewis George, have framed the upcoming debate as needed after “kicking the can down the road.” Mayor Bowser similarly described the budget as “kicking the can down the road” in declining to sign it, but from the perspective of delaying difficult spending decisions.
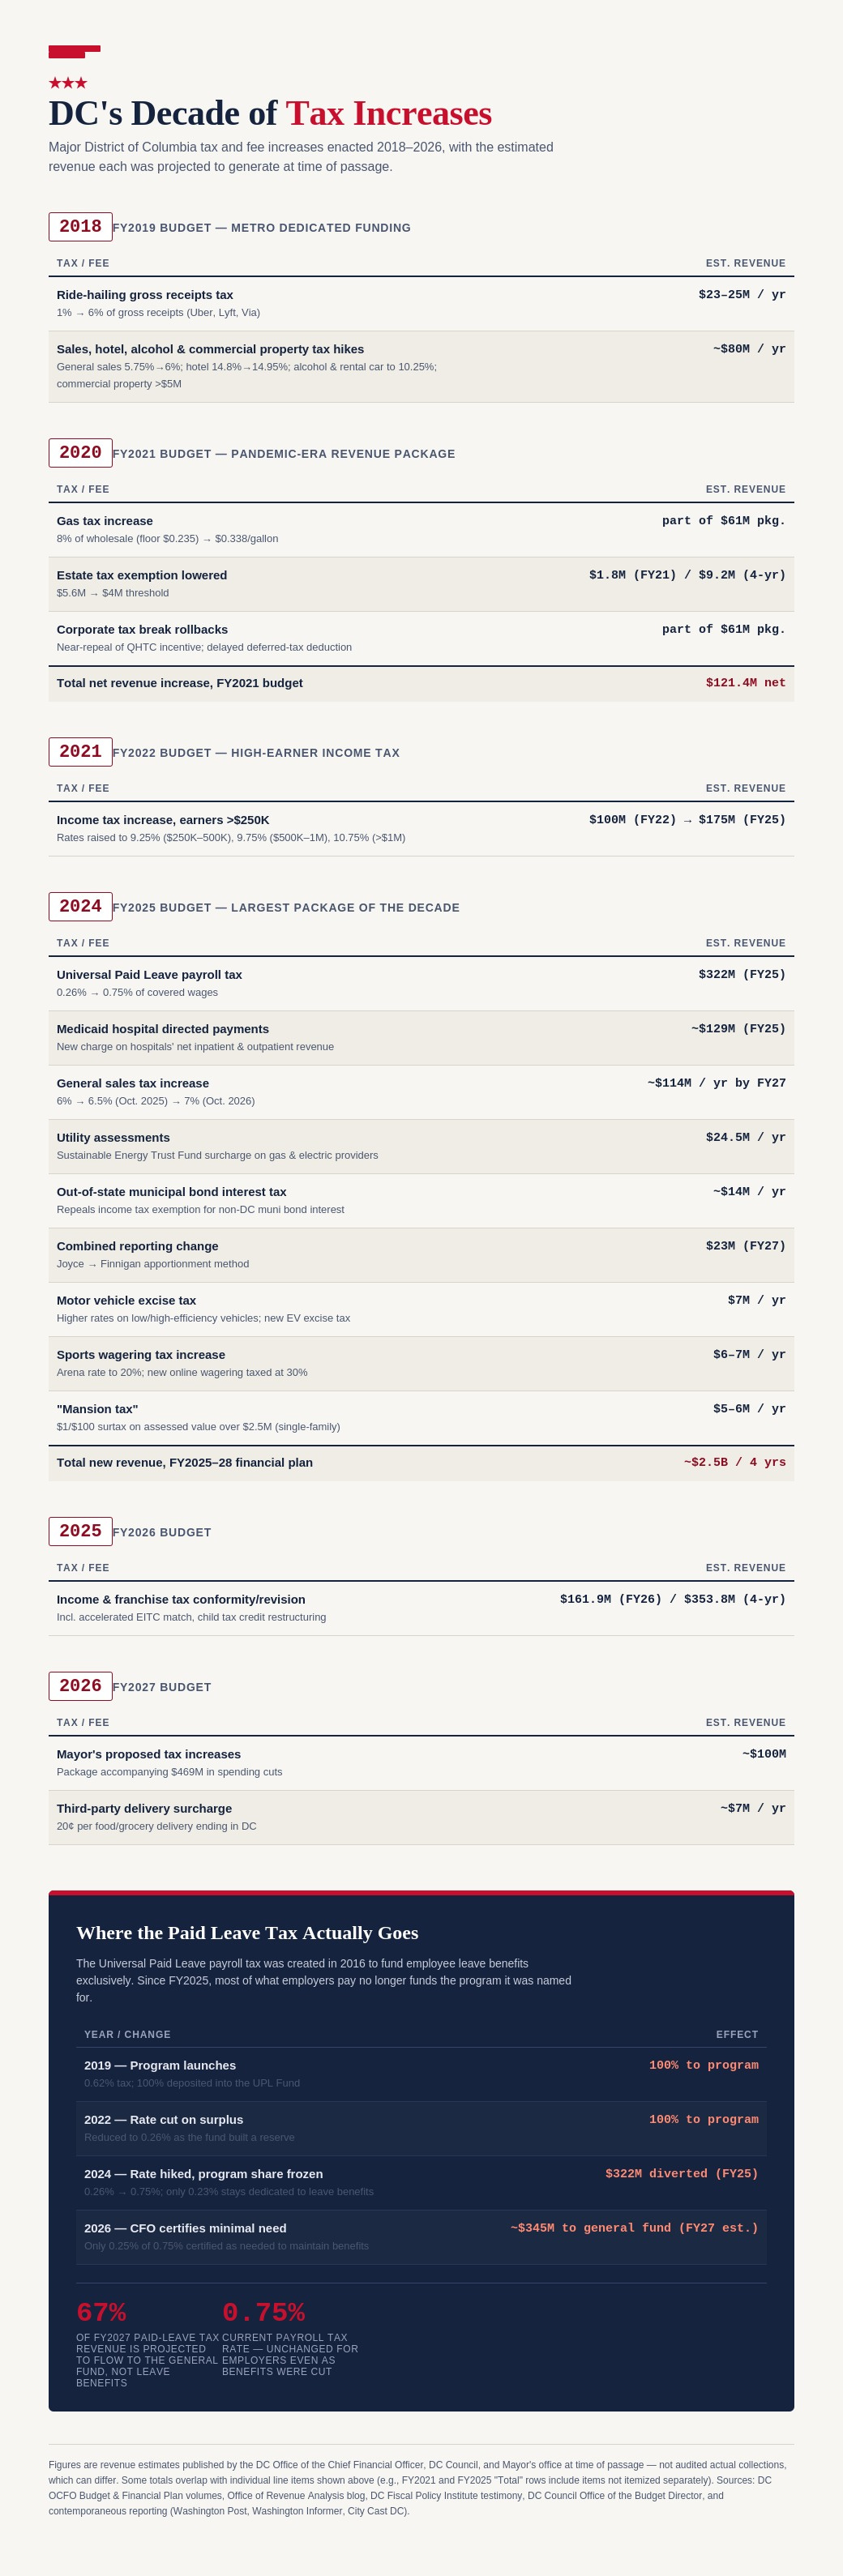
While it is certainly true that the Council kicked the can down the road on both revenue and spending in this budget, this framing is misleading with respect to tax policy overall. The Council has not shied away from approving revenue measures over the last decade. Over the last decade, the Council has increased taxes and fees on top earners, businesses, commercial property, utilities, sales, mansions, hospitals, gas, cars, and sports betting.
To be clear, these revenue increases have funded critical services like Metro (which I ride daily) and the new paid leave program, but to imply the District has resisted raising revenue to both support existing services and create new programs is simply not accurate.
To have a substantive debate about revenue that carefully weighs the tradeoffs around economic growth and retaining and attracting the upper-income residents who increasingly sustain our tax base, we first need to be honest about what District tax policy and collections has looked like over the last decade.
The upshot of what follows is that tax increases have not compensated for a weaker economy, slower growth, and increased spending. Real revenue per capita is up since 2016 and real income tax revenue per capita is way up. We bring in more revenue today than we did 10 years ago by any measure.
District Tax Revenue and Income Tax Revenue Per Capita
Tax Revenue Per Capita, FY 2016–2025
The following four charts track the District’s tax revenue over the last decade. (Governmental-funds tax collections divided by resident population, shown in both nominal and inflation-adjusted (constant 2025) dollars. Fiscal year runs Oct 1–Sep 30.)
Key takeaways
Nominal growth is steep: Total tax revenue per resident rose about 51% from FY 2016 to FY 2025, and income tax revenue per resident rose about 95%.
Real total tax revenue per capita is moderately higher: In constant 2025 dollars, total tax revenue per resident rose ~13% over the decade, peaked near $16,350 in FY 2022, fell back to about $15,000 by FY 2024, then rebounded to $16,033 in FY 2025.
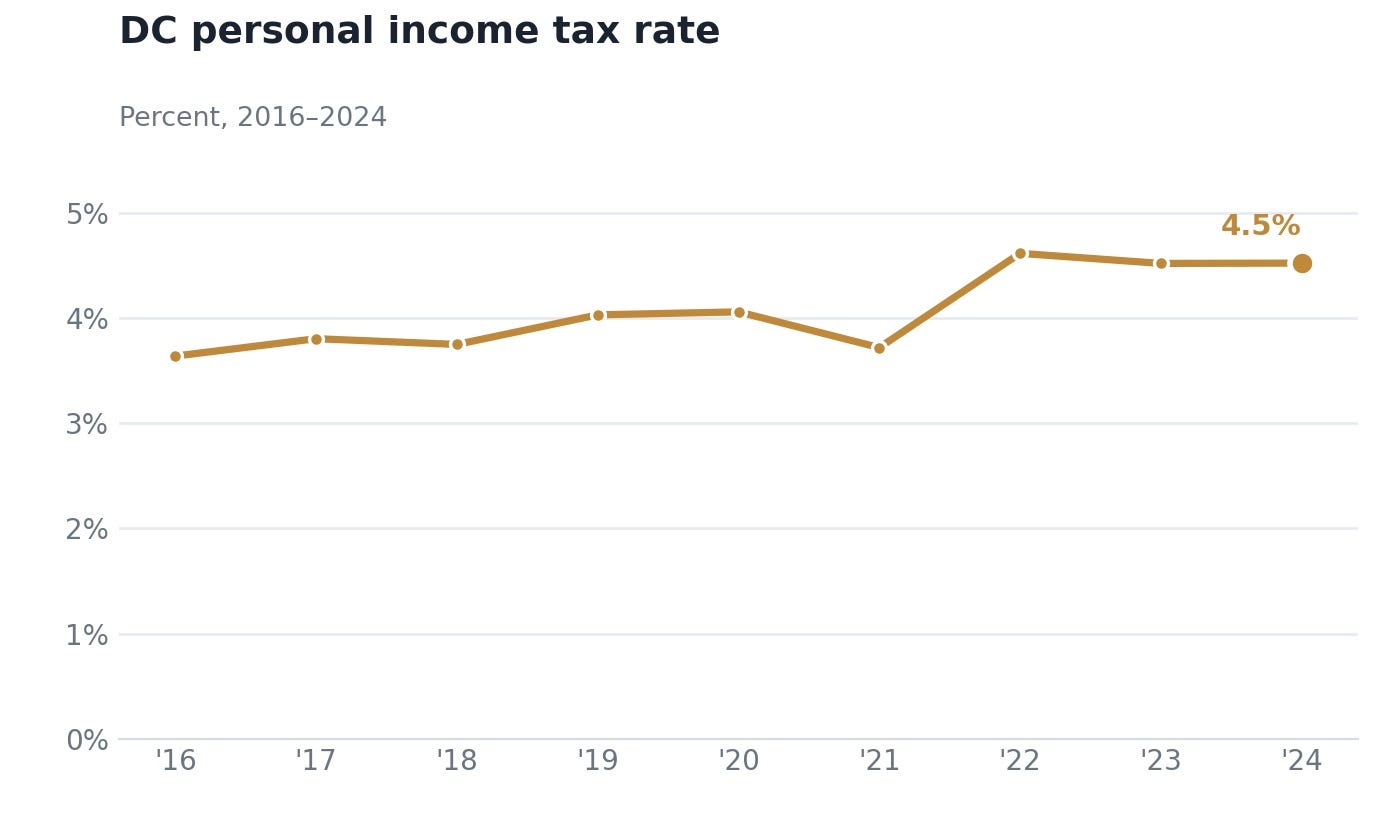
Income tax revenue outpaced inflation: Real income tax revenue per resident grew about 45%, reflecting the District’s increasing reliance on income and capital gains taxes relative to property and sales taxes. The increase is not solely attributable to the District becoming wealthier, as the overall personal income tax rate increased by about a point over the last decade.
The District’s Chief Financial Officer echoed these general trends in a February 2026 update to Mayor Bowser and the Council, noting strong income tax collections and weak sales and property tax collections.
While individual income tax collections are stronger than expected, the other major source of growth is gross receipts tax revenue, driven by policy actions that increased hospital inpatient and outpatient fees. Somewhat offsetting the strong growth in income and gross receipts taxes are declines in sales and deed tax collections.
Total tax revenue per capita
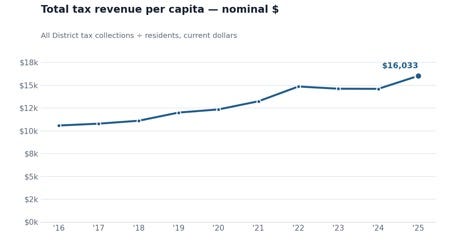
Figure 1. Total tax revenue per resident — nominal dollars.
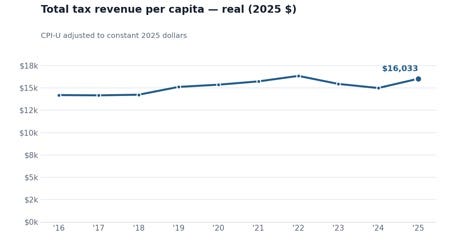
Figure 2. Total tax revenue per resident — constant 2025 dollars (CPI-U adjusted).
Income tax revenue per capita
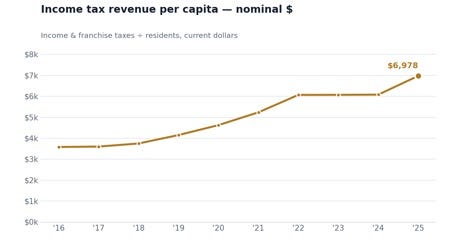
Figure 3. Income & franchise tax revenue per resident — nominal dollars.
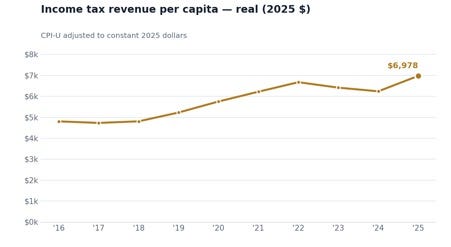
Figure 4. Income & franchise tax revenue per resident — constant 2025 dollars (CPI-U adjusted). (Note: Real non-income tax revenue per capita has declined since 2016 from $9,220 to $9,055.)
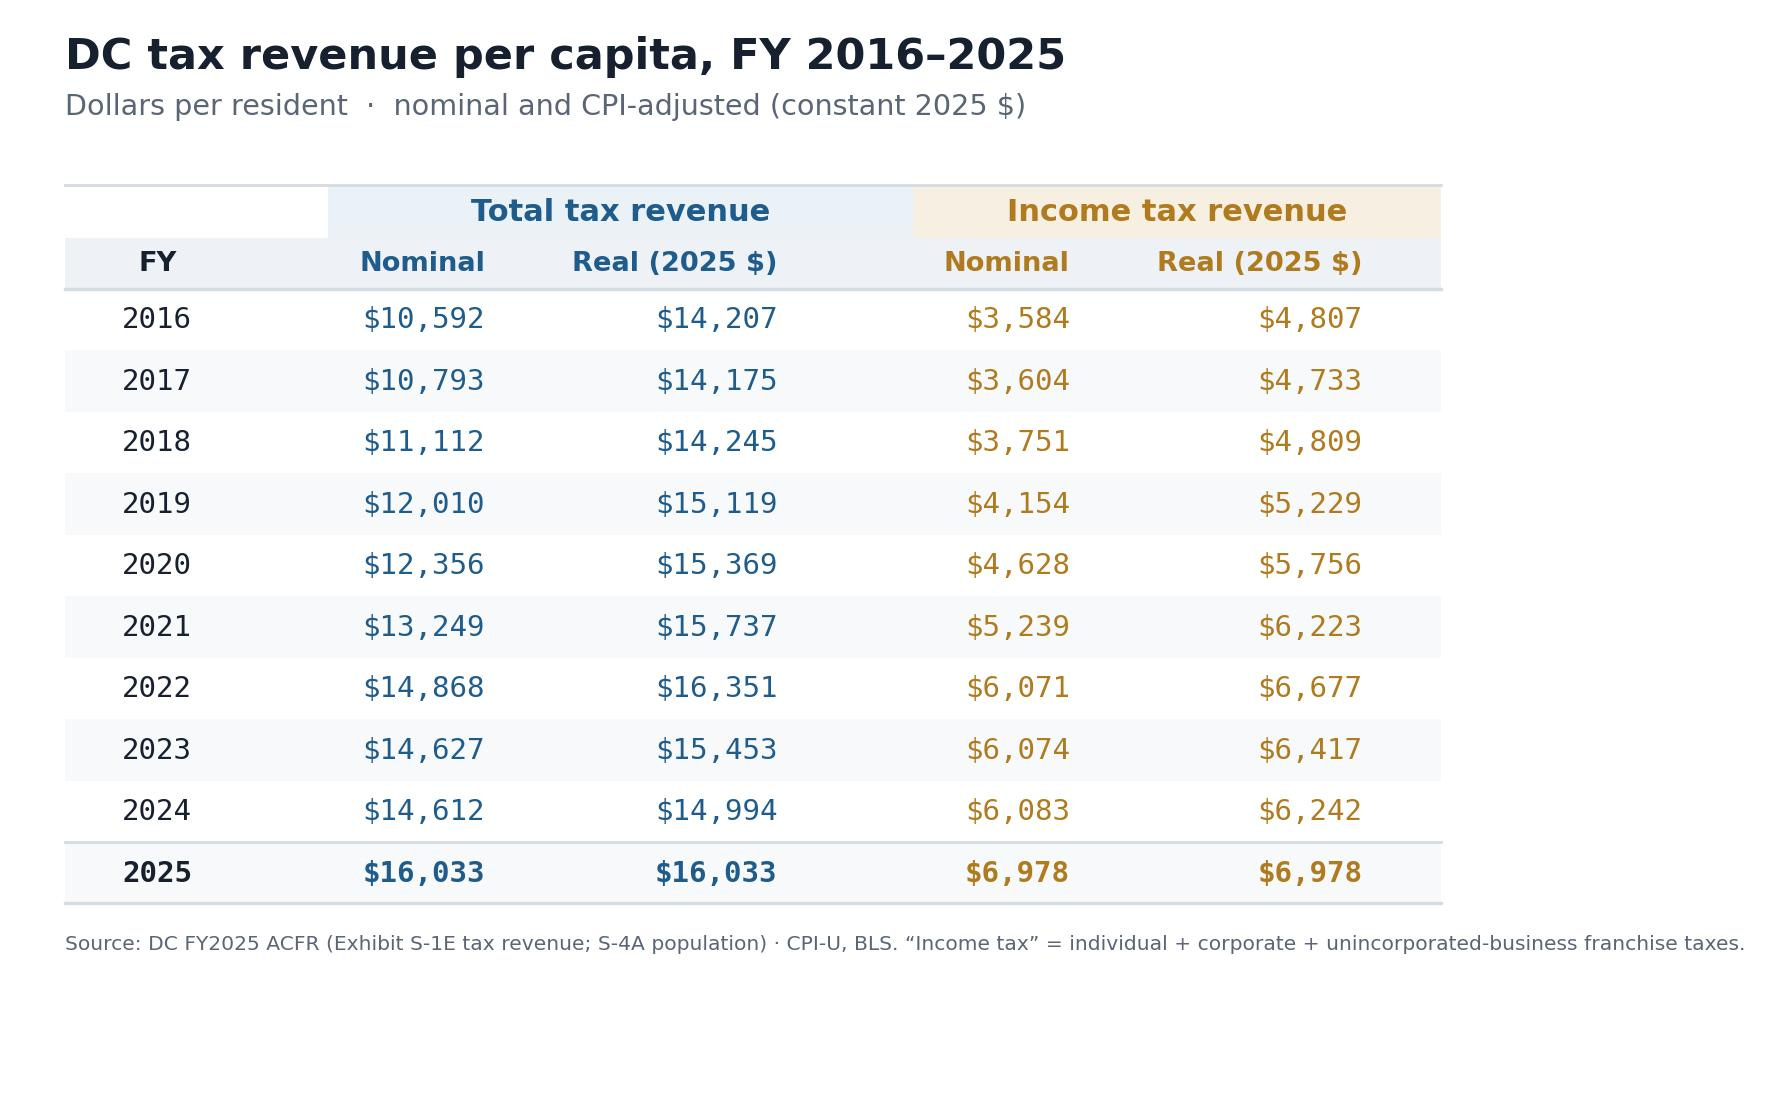
Figure 5. District overall personal income tax rate
Tax Increases Over the Last Decade
The following chart captures the many ways the Council has raised additional revenue over the last decade. When the District’s elected leaders tell residents that we have a revenue “problem,” that’s not the case. Additional revenue can certainly be part of a longer-term solution to our fiscal strain, but reinvigorating our economy and controlling spending must be central given that spending has outrun a decade of new revenue, including significantly increased income tax collections.
On the income tax, the top of our bracket system was restructured in 2021: the Council capped the existing 8.5% bracket at $250,000 and added new high-income brackets on top of it. Under the new schedule, income between $250,000 and $500,000 is taxed at 9.25%, income between $500,000 and $1,000,000 at 9.75%, and income above $1,000,000 at 10.75%—up from a previous top rate of 8.95%. The three brackets below $250,000 were left unchanged. The D.C. income tax brackets are not indexed to inflation, so they capture more income over time. Limits on SALT deductions at the federal level also reduced upper-income filers’ ability to deduct increased District taxes from their federal taxes.
In the case of the Universal Paid Leave payroll tax enacted in 2016 and implemented in 2019, two-thirds of the revenue collected from the tax—$345 million per year—now flows to the General Fund, not paid leave. The tax was cut from 0.62% to 0.26% when the program had a surplus, but the Council raised it two years later to 0.75%, with excess funds being used to fill budget gaps. Councilmember Elissa Silverman has called this out to her credit, which I noted during the campaign.
Sources & Notes for Tax Per-Capita Charts
Tax revenue: DC FY 2025 Annual Comprehensive Financial Report, Exhibit S-1E (Tax Revenues by Source, governmental funds, modified accrual). Population: DC FY 2025 ACFR Exhibit S-4A (U.S. Census July 1 estimates); FY 2025, absent from the ACFR, uses the Census December 2025 estimate (693,645). Inflation: U.S. Bureau of Labor Statistics CPI-U, all items, U.S. city average, calendar-year annual averages (1982-84=100); real figures are in constant 2025 dollars.
“Income tax” follows the ACFR grouping: individual income tax plus corporate and unincorporated-business franchise taxes. Individual income tax alone was about $3.14 billion in FY 2024 (roughly 73% of the group).
Caveats: calendar-year CPI is matched to each Oct–Sep fiscal year as an approximation; the Census revised its 2024 estimate down to 691,310 in the December 2025 release, so the FY 2024→FY 2025 step mixes population vintages; figures cover tax revenue only and exclude federal grants and non-tax revenue such as fees and fines.
When it comes to the income tax, the Council has left the current structure in place, choosing to raise the rate rather than look at the base.
The current D.C.income tax system allows couples filing a joint federal return to file as individuals. Maryland and Virginia require filing with the same status as federal. The D.C. system is complicated, confusing, and unfair to single people.
Here is why. Take a two-earner couple with a taxable income of $260,000. When the couple files D.C. income tax, they do so as individuals. If one made $90,000 and the other made $170,000, they would pay $15,400. A single person making $260,000 pays $18,900. The single person pays $3,500 more.
The difference does not end there. D.C. allows a couple to allocate deductions any way they want. That means the lower earner can assign all tax deductions to the higher earner. This rule lowers their tax even more. Again, the system benefits couples and slights single people.
If D.C. adopted filing status conformity, it would mean a higher taxable income base. That, in turn, means D.C. could raise an equal amount of revenue with a lower tax rate. Doing so would also greatly simplify tax administration and be far fairer to single people. Raising the tax rate on the current system perpetuates an unfair and byzantine system